Ultra-sonication treatment for saline groundwater: A new innovative approach for preventing emitter clogging in surface drip irrigation systems
Abstract
Clogging is a serious problem in drip irrigation, especially when using saline groundwater; this may cause uneven water distribution. However, efficient and environmentally friendly methods are rarely available for mitigating clogging. In the present study, an innovative and environmentally friendly technology using ultrasonic waves within radio frequency without the use of chemicals to treat emitter clogging, is evaluated. The objectives of this study were to evaluate the chronological changes in the emitter flow rate and the effect of ultrasonic (US) water treatments on solving the problem of emitter clogging in the field. The performance of the drip irrigation system is tested by measuring emitter discharge and estimating the average emitter discharge (qav), the manufacturer coefficient of variation (CVm), the distribution uniformity of the lowest quarter (DUlq), the application efficiency (AE) and the Christiansen uniformity coefficient (CUC). The results showed that the qav for the emitters improved from 3.37 l/h before treatment to 4.1 l/h after 180 h of US irrigation water treatment. The DUlq and the AE of the drip irrigation system were respectively 76.7% and 69.1% before treatment, due to the presence of salts in the groundwater, which caused emitter clogging. After 180 hours of US water treatment, DUlq and AE improved to respectively 90.3% and 81.3%. This improvement led to saving about 15% of the daily irrigation water. This study showed that ultrasonic water treatment is highly effective as chemical-free treatment method with great potential for preventing emitters clogging in drip irrigation systems, and could be further promoted in drip irrigation with saline groundwater.
Keywords: Clogging, drip, irrigation, emitter, saline groundwater, ultrasonic
INTRODUCTION
Sustainable groundwater management has become one of the biggest challenges to meeting the demands of present-day and future development programs (agricultural, urban, industrial, etc.). Extraction or changes to recharge can alter groundwater flow directions or expose aquifer to natural contaminants such as salt and some trace elements, resulting in poor water quality and associated health impacts (Sadek et al., 2020). The overexploitation of groundwater may cause the coming of saline deep water or an inland invasion of seawater. Egypt has to face an exceeding shortage of water resources while the population rate progressively increases and standards of living rise. Egypt has launched a strategic plan to accommodate the water and food deficit by extending agricultural lands to the desert areas, which are located at the periphery of traditionally cultivated lands in the Nile Delta and Valley.
The primary requirements for meeting the objectives of agricultural growth and desert reclamation in remote areas far from the Nile River and irrigation canal network are sufficient quantity and quality of groundwater resources (El Bedawy, 2014).
With the exception of irrigation salt-tolerant crops, the high concentration of salts in groundwater created a bottleneck that made its use in agriculture problematic. The extra salt in the irrigation water has caused the soil to become salinized, which is another issue in this situation. Emitter clogging is another effect of the excessive salt concentration. The main reason for emitter clogging in drip irrigation systems is the very narrow (0.5-1.2 mm) flow path of the emitter, which allows salt ions from saline water to accumulate and form precipitates within the path.
In addition to the stress that the plant experiences from salinity, emitter blockage negatively impacts crops by drastically reducing irrigation uniformity (Li, et al., 2019).
One of the best strategies to deal with the scarcity of water for agriculture is to use saline water in conjunction with drip irrigation. The risk of fouling, which causes emitter clogging, is the main limitation on the use of salt water in drip irrigation systems. In particular, using salty groundwater can exacerbate emitter clogging to a great extent, shortening the drip irrigation systems’ operational lifespan. Furthermore, because fertilizer contains ions that react with Ca 2+and Mg2+ in the saline water to generate precipitates, drip fertilization would worsen emitter blockage and fouling (Muhammad et al., 2021).
Previous research on the use of saline water in drip irrigation has mostly concentrated on how the water affects the distribution of water in the soil, plant development, yield, and crop quality (Karlberg et al., 2007; Kang et al., 2010; Sharma et al., 2013). However, saline water contains a large number of salts, and salt deposition and recombination are common. Chemical precipitations frequently result in emitter clogs in drip irrigation systems because of the emitters’ enormous size and intricate construction. Saline water clogs pipes more thoroughly and by a more complex mechanism, which raises the likelihood of clogging (Dehghanisanij et al., 2007).
Crop productivity and water consumption efficiency both suffer when emitters clogged, as this lowers the effectiveness of water distribution. The most challenging issue that arises while using drip irrigation systems is clogged emitters. Clogged emitter replacement, cleaning, and detection are difficult tasks. According to Al-Mefleh et al. (2015), precipitates, particles in the water supply, or bacterial slime from dissolved calcium or other salts in the water supply can all clog emitters. The reasons behind clogging vary depending on the place (Nakayama and Bucks, 1991). Therefore, when using saline groundwater, emitters’ performance needs to be assessed in real-world settings.
With ideal drip irrigation, practically the same amount of water may be given to each plant. Poor water distribution among the plants due to clogging can result in either excessive or insufficient plant watering. Overwatering causes deep percolation, which has negative effects on groundwater contamination risk, energy costs, fertilizer leaching, and drainage requirements. On the other hand, inadequate watering due to severe emitter blockage might restrict plant development or possibly result in plant mortality (Puig Bargues et al., 2005).
The desalination of water for drinking is the only application for modern desalination methods, which are energy-intensive and deemed ineffective for use in agricultural irrigation. The influence of this technique on emitter clogging and soil salinity has been researched along with some research on magnetization techniques for preprocessing irrigation water (Aali et al., 2009; Sahin et al., 2012). In order to lessen chemical clogging in salty drip irrigation systems, chemicals or biological agents are added to the sophisticated post-processing of irrigation water (Hills et al. 1989; Yuan et al., 1998; Eroglu et al., 2012). Therefore, in order to avoid the issue of dripper clogging or the ensuing salinization of the soil, a fresh, clean, and ecologically friendly technique is needed to handle groundwater salinization in the new reclamation regions.
Consequently, using saline groundwater raises serious concerns about the emitter clogging problem. On the other hand, research on the impact of ultrasonic treated water on drip irrigation system emitter clogging is still in its infancy. Therefore, it is imperative to address the issue of point clogging caused by irrigation with salt groundwater. This is because clogging exposes plants to both salinity and water stress, which is detrimental to crop growth. Additionally, dripper clogging damages the soil beneath the drippers by reducing its moisture content, which raises the concentration of salts in the soil and brings them closer to the roots of plants. As a result, low-power technologies like ultrasonic (US) have been developed; unlike reverse osmosis (RO) and other costly procedures that need expensive annual maintenance in addition to operational experience, these low-power technologies technologies are well suited for agricultural applications. Sonication, or the application of ultrasonic (US) waves with a frequency of 40,000 Hz (40 kHz) or more, is one of the novel technologies that has been utilized to improve the water treatment process. This method could enhance the environmental aspects of the water treatment process.
To understand and analyze what happens to the drippers because of salts, this research first examined the effect of irrigation with saline groundwater on the efficiency of the drip irrigation system in Samalut, Minya, Egypt, one year after the network was installed. This was done by comparing the results of farm evaluation with those of laboratory tests for new drippers.
The sixth-generation Max Grow device was utilized to apply ultrasonic technology (US) in order to address emitter clogs and enhance the effectiveness of the drip irrigation system in the area. Numerous studies have looked at how the US affects the chemical and biological characteristics of water; however, none have looked at how US-treated water affects the performance of farmers’ existing drip irrigation systems.
Therefore, in order to assess the effectiveness of ultrasonic (US) water treatments in resolving emitter clogging in real-world settings and investigae their impact on drip irrigation performance and efficiency, we chose the most representative area within an arid agricultural region in El Minya governorate, Egypt.
MATERIALS AND METHODS
Experimental location
The study location is situated at 28° 13’ 24.3” N and 30° 33’ 27.5” E on El-Minya Governorate’s western desert route. The Assiut Airport station provided the climatological data for the experimental site. The climate in the region is hot, dry and semi-arid. Summers are rainless, and winters are mild with sporadic precipitation. Over the past ten years, El Minya’s average rainfall has varied between 23.5 and 33.2 mm/year, while its annual evapotranspiration has been 4898 mm. The average temperature ranges from 4.55˚ to 19.5˚C in January and from 21.5˚ to 47.8˚C in August. January and June have different relative humidity levels roughly 67 % and 71 %, respectively.
Experimental layout
In sandy soil, with 50 cm between each dripper, we began our experiment with a one-year-old drip irrigation system. The farm has a total size of 64.7 hectares. For the purpose of conducting the experiment, 2 hectares were selected to represent the entire farm. As shown in figure 1, drip irrigation system has cylindrical drip emitters placed 0.5 meters apart and a nominal diameter of 16 mm was employed. Table 1 show that the new emitters discharged at a rate of 4.1 l/h at 100 KPa pressure.
Irrigation System Components
Deep-Well Pump
An electrically powered deep-well turbine pump of about 60 horsepower is used to lift water from underground to discharge into the main line of the irrigation system. A well static groundwater level ranges between 20 – 40 meters. The deep-well pump works as the only primary source of water.
Irrigation pump station
The pump station installation includes an electrically powered vertical centrifugal pump house and the pipe inlet with a butterfly valve. The pump station is designed for a water duty, of 1 m3/h per hectare approximately. The pump stations contain electrically powered centrifugal pumps. No standby units are provided.
Drip System for grapes
Grapes trees are planted at 2 x 3 m spacing and each row of trees has 2 rows of drip lines. Each tree is provided with 8 drippers at working pressure of 100 KPa for 3 hours. The drip line has a length, of 45 m serving about 22 trees used (Figure 1).
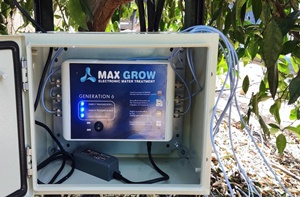
MAX-GROW device
To address the issues brought on by saline water, the Max Grow electronic water treatment system (Figure 2) transmits ultrasound waves (US) many times within radio frequencies (RF). It produces safe, easily eliminated by-forms by differentiating the mineral salts with up to a million vibrations per second. The device emits ultrasound waves at continuously changing frequencies, completely dissolving the salt ions in water. By programming the device with a mathematical system, it transmits the US automatically at multiple frequencies and continually every ten minutes.
The irrigation water passing through the device installed on the sub-main line of 100 m3/h discharge for groundwater treatment as shown in figure 2 (Max-grow Salinity Solution Ltd). External power supply transformer (industrial type) AC Input DC Output (100 - 250V / 24V) 2.5 A 50Hz/60Hz with power filtration and integrated shortcut protection with European (EU) standards plug. The device is mounted on a 4-inch pipe by winding wires on the pipe, through which ultrasonic and radio waves are transmitted.
Chemical and physical properties of groundwater
Three groundwater samples were taken before treatment to perform hydro-chemical investigations to characterize the sources of dissolved ions and analyze the chemical quality of groundwater in order to examine the physical and chemical features of groundwater in the experimental area. Five irrigation water samples were collected: once prior to the Ultrasonic devices’ setup (control), and then every fifteen days after. The collected water samples were analyzed for pH, EC, soluble cations and anions and chemical analysis. Additionally, an atomic absorption spectrophotometer was used to quantify the amounts of soluble Fe, Zn, Cu, and Mn (Table 2).
The laboratory evaluation of the drippers
The National Irrigation Laboratory of the Agricultural Engineering Research Institute (AEnRI), ARC, Dokki, Egypt, conducted a laboratory test of the drippers. Using only fresh water, the emitter discharge rates for the new drip lines which were derived from the same drip lines put in the field were measured in the lab. As a first experiment under lab conditions, emitter discharge values for new emitters were tested in the lab at five operating pressures (50, 75, 100, 150, and 200 KPa). The starting values (i) of the discharge exponent (X), the discharge coefficient (K), and the coefficient of variation (CVM) were estimated through measurements (Karmeli and Keller, 1974).
For the new emitters, the discharge exponent (X) was estimated using Equation (1), and the discharge coefficient (K) was estimated using Equation (2).
Where Qavg1 is the average discharge at operating pressure (Havg1) of 200 kPa, Qavg2 is the average discharge at operating pressure (Havg2) of 100 KPa.
The mean discharge of the emitters (qav) in each lateral, the Christiansen Uniformity coefficient (CUC), the Coefficient of Variation (CVM) and the Distribution Uniformity of the lowest quarter (DUlq) are the primary metrics used to assess an emitter’s performance. By dividing the total of each lateral line’s individual discharge by the number of emitters, the average discharge was calculated. By dividing the average emitter discharge by the standard deviation of each lateral line’s emitters, the CVM was computed. By dividing the average discharge of each lateral line by the mean discharge of the lower quarter, the (DUlq) was calculated.
Field Evaluation parameters of the drip irrigation system
From May to December 2022, outdoor evaluation experiments were carried out. Four collection points: the first lateral line dripper, a dripper at 1/3 of the lateral line’s total length, a dripper at 2/3 of the length and the last dripper are needed for each drip line in order to meet the criteria of the data collection methodology, according to Bralts and Edwards (1986). This adds up to 16 aggregation areas, the emitter discharge measurements along eight lateral lines on a sub main: four in the middle at the one-third and two-thirds positions, two at the far end, and two at the inlet. On each lateral, four spots are tested: two in the middle at the one-third and two-thirds positions, one at the far end, and one at the inlet. This results in 32 measurement locations overall.
At every measurement site, the emitter discharge of two nearby emitters is measured. The flow volume gathered in a catch container over a period of three minutes was measured to achieve this. Utilizing information from the 32 locations, the average discharge, minimum discharge, and coefficient of variation are computed. After 10 minutes of running the pump, 4-L catch-cans were positioned beneath the assigned emitters to make sure the water reached the end of the line and the water pressure reached the 100 KPa needed for evaluation. This ensured the regularity of the water distribution. A graduated cylinder was used to measure the water volume in each catch-can once the test run was finished.
Emitter flow was measured at the beginning and after 45, 90, 135, and 180 hours of treatment at an operating pressure of 100 KPa. Using the emitter reduction relative flow (Rq), distribution uniformity of the lowest quarter (DUlq), Christiansen’s uniformity coefficient (CUC), coefficient of variation (CVM), and emitter flow variation (EFV), the emitter clogging level was assessed. The following were the methods of calculation:
• Initially, the emitter discharge reduction percentage Rq % was used to assess the clogging performance (ISO, 2003):
Where q new is the mean of measured discharge for new emitters (l/h) and q is the mean of measured discharge for evaluated emitters (l/h). The emitter discharge reduction percentage for a plot was defined as the mean of Rq for the evaluated emitters in the plot.
Also, Keller and Karmeli (1974) calculated the Distribution Uniformity of the lowest quarter (DUlq) as follow:
• If the entire area obtains at least the required actual level, then (DUlq), the water distribution measure, refers to the fourth part of the total area and receives less water with the average level applied. With drip irrigation, the Distribution Uniformity of the lowest quarter (DUlq) is determined using ASAE Standard EP458 (ASAE Standards, 2003). To do this, catch cans are set up on the ground to collect and measure the water that the emitters apply. Next, an average catch-cans volume for the full sample is calculated, along with an average for the catches that make up the lowest 25% of the total. After calculating these two averages, they are expressed as a ratio (low quarter of discharge average divided by discharge average overall) and translated to a percentage.
A low DUlq value indicates excessive percolation loss, which can be observed in Equation:
Where DUlq: the Distribution Uniformity of the lowest quarter (%); qn: the mean value of 25% of the lowest flows (m³h-1); qav: the means of all flows (m³ h-1).
• Water Application Efficiency (AE %) of drip irrigation depends on the ratio of transpiration to application and the uniformity of application. Application efficiency was calculated by using Keller and Karmeli (1975) equation.
Where TR = 0.90, a reasonable management expectation.
AE % = 0.90 * EU (Keller and Karmeli, 1974)
• Another important parameter in localized irrigation is the manufacturing coefficient of variation (CVm), numerous guidelines have been suggested to classify CVm values, but those given in the ISO standards (International Standard, 1991) are used in this study and presented in Equation (6). The variations in flow rates are caused by chemical clogging:
Where CVm: Coefficient of variation (%); S: standard deviation (m³h-1); qav: means of all flows (m³h-1).
The drippers have been classified into quality categories according to (CVm) as presented in table 3.
For the CVm, if the value is less than 0.05, the performance is excellent. If the value is greater than 0.15, it is classified as unacceptable performance.
• Christiansen’s uniformity coefficient (CUC)(Christiansen, 1942), is one of the most widely used method, as it adopts the absolute mean deviation as a measure of dispersion, as can be calculated using equation (7).
• Finally, the emitter flow variation (EFV %) indicates the degree of uniformity of water from the drip irrigation system into the field, which is a key factor to estimate the effect of clogging on irrigation efficiency. The EFV is mainly affected by hydraulic design, manufacturer variation, temperature changes, and clogging. Assuming the temperature variation is small, so the total emitter flow variation will be a combination of hydraulic variation and the variation caused by the clogging problem. Bralts and Wu (1980) calculated the Emitter Flow Variation (EFV) by comparing maximum and minimum emitter flow and were expressed as followed:
Where, EFV is emitter flow variation (%), qmax. Is maximum emitter discharge (l h-1) and qmin is minimum emitter discharge (l h-1).
RESULTS
The initial characteristics of new emitters
The coefficient of variation (CVM), discharge exponent (X), and flow coefficient (K) for the new emitters were measured and are presented in table 4.
The new drippers’ nominal flow rate at 100 KPa was 4.1 liters per hour, and the manufacturer’s coefficient of variation (CVM%) was 3.9 %, indicating good manufacturing quality (Table 4). The emitter discharge exponent (X) was approximately 0.50, indicating turbulent flow, the emission uniformity under laboratory conditions (EU) was approximately 95 %, and the emitter flow variation (qvar) was 9.3 %, earning the drippers an Excellent classification from ASAE in 2003.
Field evaluation of the drip irrigation system
In drip irrigation systems, saline water-induced chemical blockage is typically accompanied by physical obstruction. Figure 3 outlined the mechanisms causing the obstruction. Saline water with high concentrations of anions (CO32-, PO43-, SO42-, and OH-) and cations (Ca2+ and Mg2+) frequently produces chemical precipitation that is deposited on the surface of the emitter’s flow path. This crystallization fouling subsequently forms, causing chemical clogging of the emitters. Second, crystallization pollution aggravates particle deposition and causes physical blockage of emitters by making the surface of the water flow route inside the dripper rougher and changing the way unfiltered sediment particles are transported in irrigation water. Ultimately, the clogging materials that have formed are deposited in the emitter, where they reduce the flow rate, EU and CUC. These factors then have an impact on the soil, crop quality and crop yield.
Effect of salinity and US water treatment on emitters clogging
The evaluated emitter is considered to be clogged as the discharge reduction percentage Rq is greater than 25 % compared with the initial discharge (ISO, 1997). Table 5 shows the discharge reduction percentage Rq before US treatment and during the treatment at specific intervals of the treatment process.
Figure 4 shows the average discharge of the inline emitters before US treatment and during the treatment at specific intervals of the treatment process. The average flow of the emitters after one year of operation of the drip irrigation system in the field was 3.37 l/h with a decrease of about 15.7 % compared with the new dripper as a result of chemical clogging; due to irrigation with saline groundwater.
The systems often experienced significant blockage following a year of operation (without our assistance). The findings demonstrated that the emitters’ evaluated discharge was reduced by over 10 % at the start of the lateral line, roughly 17 % in the middle, and over 47.8 % at the end of the lateral (Table 5). This indicates that the emitters were partially clogged at the start of the lateral line, partially clogged in the middle, and completely clogged at the end of the lateral.
The outcome showed that the end of a lateral has the largest risk of chemical clogging because there is less water shear force and velocity there, which causes a larger buildup of clogging materials (Shi et al., 2022).
An estimate is made of the average ratio between the total number of emitters analyzed and the number of clogged emitters. Prior to US treatment, almost 25 % of the assessed emitters had blockages, and 31 % were entirely blocked (Table 5).
Clogging materials are visible everywhere on the dripper, including the entrance, core flow channel, and outflow. The predominant location for the deposit of clogging substances is the core flow channel of the drippers, as indicated by the ratio of clogging position at the emitter’s output (7–34 %), 44–60 % at the core flow path and 22–33 % at the inlet.
According to the Rq examination, the drippers were typically clogged. The primary cause of emitter clogging is the extremely tiny (0.5–1.2 mm) core flow path of a drip irrigation system, which allows a lot of salt ions from saline ground water to readily recombine and precipitate inside the flow path.
Rq showed that the US treatment process had a significant effect on dissolving salts fouling inside the drippers and reducing clogging (Table 5). There was a slight change in the occlusion rate after 45 h of the treatment, but after 90 hours there was a decrease in the occlusion rate of about 32.4 %. After 135 h of US treatment, The Rq ratio of all drippers along the drip line became less than 15 % and the fouling disappeared from the dripper exactly as shown in figure 5. The Rq decreased from 47.8 % before treatment to 14.6 % after 135 h of US treatment at the end of the lateral line.
Effect of Salinity and US water treatment on the Distribution and Application Uniformities of the drip Irrigation System
In the beginning, The results indicated that the (DUlq) of the one-year-old drip irrigation system was 76.7 %, and according to the evaluation standards of the drippers, the distribution efficiency of the system was poor as a result of the high clogging rate occurred.
Accordingly, the Application Efficiency (AE) of the drip irrigation system was as low as 69.1 % before the US treatment process, due to the accumulation of salts occurs over time inside and outside the emitters, which causes emitters clogging and reduces its flow rates.
The Results of the ultrasonic treatment process, as presented in figure 6, indicated that after 45 h of treatment, the DUlq increased from 76.7% to 81.7, which also reflected in the water Application Efficiency (AE) as it was increased from 69.1% before treatment to 73.5% after US treatment.
As the ultrasonic water treatment process continues, the efficiencies of the drip irrigation system improved. From figure 6, the result showed that after 135 hours, the DUlq increased from 76.7% before treatment to 90.1%, which is considered a significant increase, due to the ultrasonic effect on reducing emitters clogging from 44.6% to 14.6% after 135 operating hours. Consequently, all the Ultrasonic effects mentioned above resulted in improving irrigation water Application Efficiency from 69.1% to 81.4 after 135 hours of operation, and this indicates a saving of water about 15.1% from the irrigation water daily, as calculated according to the Wu and Gitlin (1983) equation (9):
Effect of Salinity and Ultrasonic water treatment (US) on the manufacturing coefficient of variation (CVm) of the drip Irrigation System
The results indicated that before the ultrasonic treatment process, the value of CVm of the one-year-old drip irrigation system was 15.5% %, and according to the evaluation standards ASAE 2003 of the drippers, the CVm was very high and unacceptable; this was a result of the high clogging rate of drippers. Lili et al (2021) showed that the more the percentage of clogging inside the drippers, the higher the CVm value of the drippers.
The Results of the ultrasonic treatment process, as presented in Figure 7, indicated that as the ultrasonic water treatment process continues, the CVm values started to decrease gradually. After 135 hours of US water treatment, the CVm decreased from 15.6 before treatment to 9.7, and this is because the percentage of clogging in the drippers also decreased after 135 operating hours from 44.6% to 14.6%. As the ultrasonic water treatment process continues, the CVm of the drip irrigation system improved. After 180 h of US water treatment, the CVm value reached 3.5 and this according to ASAE 2003 is excellent and means that there wasn’t a significant difference between the flow rates of drippers along the lateral line, which is considered a significant decrease due to the ultrasonic effect on reducing emitters clogging.
Effect of salinity and US water treatment on the Christiansen coefficient of variation (CUC)
The results illustrated that the (CUC) of the one-year-old drip irrigation system was 75.3%, and according to the evaluation standards of the drippers, the Christiansen coefficient of variation of the system was poor as a result of the high clogging rate occurred. The relative emitter flows before treatment (under saline groundwater) were 3.37 l/h (difference of 15.7%), while the irrigation uniformity was 76.7%.
The Results of the ultrasonic treatment process as presented in figure 8 indicated that after 45 h of treatment, the CUC increased significantly from 75.3 to 84.0%. As the ultrasonic water treatment process continues, the CUC of the drip irrigation system improved. From figure 8, the result showed that after 135 hours, the CUC increased from 71.5% before treatment to 95.3%, which is classified as excellent according to Bratls and Edwards (1986).
Water salinity was found to have a linear, negative connection with the CUC in (Lili, 2021). As the salinity of the irrigation water increased, the CUC values gradually dropped. This study’s findings are in line with the conclusion that high salinity in particular has a detrimental effect on the chemical clogging of emitters.
Effect of Salinity and Ultrasonic treatment on the Emitter flow variation (EFV %) of the drip System
The result showed that EFV before the US water treatment was 45%, and according to ASAE, 2003 is unacceptable and this is the result of the clogging. This indicated that there was a large clogging rate in the drip irrigation system as a result of irrigation with salt groundwater along the drip line, especially at the end of the lines, which led to a variation in the discharge of emitters along the drip line. This indicates that some plants will take less water than they need for growth, and there will be a variation in productivity and yield as well.
As the ultrasonic water treatment process continues, the EFV% decreased (Figure 9). After 90 hours of US water treatment, the EFV% decreased from 45.4% to 30.5%, but it is still unacceptable according to the standards, and there is a significant difference in the discharge of the drippers. The result showed that after 135 hours, the EFV% became 15%, which is the acceptable limit (less than 20%), and after 180 hours of operation, it became 12.5% which is excellent (Bralts and Wu 1980), as a result of the absence of clogging in the drippers. These results agree with Lili et al., (2021) who explained that the relationship between EFV and clogging is an inverse relationship.
DISCUSSION
According to this experimental research, irrigation effectiveness decreased as emitter obstruction got more severe. Prior research on the effect of salinity on drip irrigation only considered plant production and the dispersion of salt in soil water, ignoring the impact on the effectiveness of drip irrigation systems. Since there haven’t been enough studies on salt water drip irrigation, we started by looking into how saline water affected emitter clogging in a drip system used to irrigate grapes. All the saline water drip irrigation system’s emitters showed clogging after a year, and the DUlq, AE, and CUC respectively dropped to 76.7%, 69.1%, and 75.3%. The findings verified that saline water causes clogging issues when used in drip irrigation (Aali et al., 2009; Dehghanisanij et al., 2007; Hills et al., 1989; Sahin et al., 2012). The findings demonstrated that the salinity of irrigation water directly affected crop growth and yield, soil moisture, nutrient, and salinity distribution, and fouling buildup in drip irrigation systems.
In addition, we have employed ultrasonic technology in this experiment as a clean and eco-friendly method that works through vibrations and primarily relies on the phenomena of ionization and cavitation in water to solve the issue of clogging in emitters. It also serves as a means of rearranging salts in the water and transforming them into a soft form that plants can absorb from the soil. Consequently, it might be suggested that the US use saline water for drip irrigation, taking into account factors such as improved soil water-salt conditions, increased crop yields, and decreased emitter clogging.
To further understand the clogging mechanism, it is crucial to identify the primary components and sites that clog emitters. According to Niu et al. (2013), physical obstruction in drip irrigation using sandy water occurred primarily at the emitter inlets. On the other hand, we observe fouling in the emitter and outlet flow paths; as saltwater passed through these paths, the ions progressively mixed to create precipitates, which adhered to the emitter’s inner wall due to the placement of the vortex. As the salinity of the irrigation water increased, so did the locations of chemical blockage in the drippers. While outlet clogging decreased, the percentage of blockage in the flow channel and intake increased (Lili et al., 2020, 2021). The high salinity encouraged chemical precipitations, which in turn accelerated the deposition of precipitates in the inlet and front of the flow route.
It is demonstrated that flow velocity, pressure, and shear stress in the laterals have an impact on emitter clogging in addition to water quality. The end of the laterals had comparatively low values for both flow velocity and water shear forces; as a result, sediments collected more readily and caused emitter clogging. These results are consistent with results from Lili et al. (2021), and the steady reduction was caused by abundant Ca2+, Mg2+, and HCO3- ions in saline water, which easily caused compounds to precipitate.
Additionally, emitter flow rates were found to have dropped through continuous emitter discharge testing, which can mostly be attributable to the chemical precipitation of Ca2+ and Mg2+. Applying irrigation water (processed water) from the US could lead the wall to become porous by melting, rusting, or peeling. This significantly decreased emitter clogging.
The ultra-sonication water treatment program altered the chemical, physical, physicochemical, and biophysical characteristics of water, resulting in altered functions. It is possible to describe how the energy of elastic vibrations at ultrasonic frequency in the cavitation mode causes the physical and chemical reactions that occur in water.
The occurrence of high temperatures at the point when a cavitation bubble collapses in water is explained, and the development of gas and air cavity bubbles in an aquatic environment is what characterizes the cavitation condition. The substance of dissociated and ionized molecules, as well as free active radicals, is being assimilated, according to researchers.
Additionally, laboratory experiments on the impact of ultrasonic vibrations in the cavitation mode on pH changes in water have been conducted. It is demonstrated that bubbles that form in the water under study collapse under the ultrasonic field, producing micro-flows, shock waves and micro-explosions. Studies on how the pH changes in water reveal that the frequency of ultrasonic waves influences pH changes. When water is treated with ultrasonic waves at a frequency of 22 kHz, its pH value rises. When water is treated with ultrasonic waves at a frequency of one megahertz, their pHs drops. The pH level of the water remains unchanged during the 8 kHz treatment.
According to the theory proposed by Sirotyuk (2008), high temperatures occurred during the moment when the cavitation bubble in water collapsed, which is consistent with adiabatic compression. These temperatures are in the order of 10,000 oK, and there is a shock wave with 104 ATM of pressure. Elevated temperatures in the bubble cavity containing dissolved gas lead to electrification as atomic hydrogen and oxygen, free radicals, and dissociated and ionized molecules develop.
Through cavitation, Khan and Adewuyi (2008) experimentally demonstrated the creation of the free radical hydroxyl OH+ and atomic hydrogen H-, whose recombination produces H2 and H2O2 molecules in water. The following responses take place in the cavitation cavity when ultrasonography is applied:
The reactions that are shown demonstrate how ultrasound-treated water forms free electrons, activated atomic hydrogen, activated hydroxyl groups, hydrogen ions, hydroxyl ions, ionized water, and hydrogen peroxide. Therefore, we select a frequency of f = 15–30 kHz for the excitation of cavitation in water, where the strength of the excitation is between 0.3 and 2.0 W/cm2. This frequency also requires the minimal sound input power.
CONCLUSION
The use of ultrasonic technique (MAX GROW) has been tried as a modern environmentally friendly technology in dealing with the drip irrigation emitters clogging problem. This technology has proven its effectiveness in eliminating dripper clogging which led to improved water distribution uniformity and increased application efficiency of the drip irrigation system. This Ultrasonic treatment of underground saline water used in drip irrigation of sandy soils could be a promising technology for agricultural development in the newly reclaimed areas in Egypt. Based on this research results, it is recommended to use this safe ultrasonic (US) technology in saline water treatment to improve the uniformity of water distribution and the application efficiency of drip irrigation systems due to its ability in reducing emitters clogging problem.
REFERENCES
Aali K.A., Liaghat A., Dehghanisanij H. (2009). The effect of acidification and magnetic field on emitter clogging under saline water application. Journal of Agricultural Science, 1: 132.
Al-Mefleh N.K., Bashabsheh, I., Talozi S., Al-Issa T.A. (2015). Field evaluation of the performance of different irrigation emitter types using treated wastewater. Water Quality Research Journal of Canada, 50: 240-251.
ASAE EP405.1 (2003). Design and installation of micro irrigation systems: standards. Society for Engineering in Agricultural, Food, and Biological Systems, St Joseph, MI, USA.
ASAE (2003). Field evaluation of micro irrigation systems; EP458; American Society of Agricultural Engineers: St. Joseph, MI, USA, pp. 760–765.
Bralts V.F., Edwards D.M. (1986). Field evaluation of drip irrigation sub-main units. Transactions of the ASAE, 29: 1659-1664.
Bralts V.F., Wu I.P. (1980). Emitter flow variation and uniformity for drip irrigation. A compilation of trickle irrigation papers (USA).
Christiansen J.E. (1942). Irrigation by sprinkling. In: California Agricultural Experimental Station Bulletin, vol. 670. University of California, Berkeley, California.
Dehghanisanij H., Anioji H., Riahi H., Abou Elhassan W. (2007). Effect of emitter characteristics and irrigation schemes on emitter clogging under saline water use. Journal of Arid Land Studies, 16: 225-233.
El Bedawy R. (2014). Water resources management: alarming crisis for Egypt. J. Mgmt. & Sustainability, 4: 108.
Eroglu S., Sahin U., Tunc T., Sahin F. (2012). Bacterial application increased the flow rate of CaCO3-clogged emitters of drip irrigation systems. J. Environ. Manag., 98: 37–42.
Goyal M.R., Mansour H.A. (2015). Closed circuit trickle irrigation design: theory and applications. In: Tayel, M.Y., Pibars, S.K., Mansour, H.A. (Eds.), Evaluation of Emitter Clogging, pp. 287–300.
Hills D.J., Nawar F.M., Waller P.M. (1989). Effects of chemical clogging on drip-tape irrigation uniformity. Transactions of the ASAE, 32: 1202-1206.
International Standard (1991). Agricultural irrigation equipment-emitters-specification and test methods. ISO 9260. Acc No. 319301, FAO.
ISO/TC 23/SC 18/WG5 N4 (2003). Clogging test methods for emitters.
Kang Y., Chen M., Wan S. (2010). Effects of drip irrigation with saline water on waxy maize (Zea mays L. var. ceratina Kulesh) in North China Plain. Agricultural water management, 97: 1303-1309.
Karlberg L., Rockström J., Annandale J.G., Steyn J.M. (2007). Low-cost drip irrigation—A suitable technology for southern Africa? An example with tomatoes using saline irrigation water. Agricultural water management, 89: 59-70.
Keller J., Karmeli D. (1974). Trickle irrigation design parameters. Transactions of the ASAE, 17: 678-0684.
Keller J., Karmeli D. (1975). Trickle Irrigation Design. Rainbird Sprinkler Manufacturing Corporation: Glendora, California, USA.
Khan N.E., Mahamuni N.N., Adewuyi Y.G. (2008). Modeling the ultrasonic cavitation-enhanced removal of nitric oxide from flue gases in a bubble column reactor. In 2008 AIChE Annual Meeting, AIChE 100.
Li Y., Pan J., Chen X., Xue S., Feng J., Muhammad T., Zhou B., (2019). Dynamic effects of chemical precipitates on drip irrigation system clogging using water with high sediment and salt loads. Agric. Water Manag., 213: 833–842.
Lili Z., Peiling Y., Wengang Z., Yu L., Mengji G., Fengru Y. (2019). Effects of drip irrigation frequency on emitter clogging using saline water for processing tomato production. Irrigation and Drainage, 68: 464-475.
Lili Z., Peiling Y., Wengang Z., Yunkai L., Yu L., Chong Z. (2021). Effects of water salinity on emitter clogging in surface drip irrigation systems. Irrigation Science, 39: 209–222.
Lili Z., Yang P., Ren S., Li Y., Liu Y., Xia Y. (2016). Chemical clogging of emitters and evaluation of their suitability for saline water drip irrigation. Irrigation and Drainage, 65: 439-450.
Malash N.M., Flowers T.J., Ragab R. (2008). Effect of irrigation methods, management, and salinity of irrigation water on tomato yield, soil moisture, and salinity distribution. Irrigation Science, 26: 313-323.
Muhammad T., Zhou B., Liu Z., Chen X., Li Y. (2021). Effects of phosphorus-fertigation on emitter clogging in drip irrigation system with saline water. Agricultural Water Management, 243: 106392.
Nakayama F.S, Bucks D.A. (1991). Water quality in drip/trickle irrigation: a review. Irrig. Sci., 12:187–192.
Niu W., Liu L., Chen X. (2013). Influence of fine particle size and concentration on the clogging of labyrinth emitters. Irrigation Science, 31: 545-555.
Puig-Bargués J., Arbat G., Barragán J., De Cartagena F. R. (2005). Hydraulic performance of drip irrigation subunits using WWTP effluents. Agricultural Water Management, 77: 249-262.
Sadek M.A., Hussien R.A., Hassan H.B. (2021). Salinization processes and quality constrains for irrigation water management in Southwest El Minia, Upper Egypt. International Journal of Research in Environmental Science, 7:1-11.
Sahin U., Tunc T., Eroğlu S. (2012). Evaluation of CaCO3 clogging in emitters with magnetized saline waters. Desalination and Water Treatment, 40: 168-173.
Sharma P., Kumar S., Sharma S.K., Jhorar R.K. (2013). Salt and water dynamics under daily irrigation with different saline water in cabbage. Ann. Biol., 29: 89–92.
Shi K., Lu T., Zheng W., Zhang X., Zhangzhong L. (2022). A review of the category, mechanism, and controlling methods of chemical clogging in drip irrigation systems. Agriculture, 12: 202.
Sirotyuk M.G. (2008). Acoustic cavitation. Moscow: Nauka, 271 p.
Vikulin P., Vikulina V. (2020). Influence of ultrasound on the concentration of hydrogen ions in water. In IOP Conference Series: Materials Science and Engineering, (Vol. 869, No. 4, p. 042007). IOP Publishing.
Wu I.P., Gitlin H.M. (1983). Drip irrigation application efficiency and schedules. Transactions of the ASAE, 26: 92-0099.
Yuan Z., Waller P.M., Choi C.Y. (1998). Effects of organic acids on salt precipitation in drip emitters and soil. Trans. ASAE, 41:1689–1696.
Zhangzhong L., Yang P., Li Y., Ren S. (2016). Effects of flow path geometrical parameters on flow characteristics and hydraulic performance of drip irrigation emitters. Irrigation Drain., 65: 426–438.
Zhangzhong L.L., Yang P.L., Zheng W.G., Liu Y., Guo M., Yang F. (2019). Effects of drip irrigation frequency on emitter clogging using saline water for processing tomato production. Irrig. Drain., 68: 464–475.
Zhou H., Li,Y., Wang Y., Zhou B., Bhattarai R. (2019). Composite fouling of drip emitters applying surface water with high sand concentration: Dynamic variation and formation mechanism. Agricultural Water Management, 215: 25-43.