Abstract
Chia (Salvia hispanica L.) crop is a newly introduced herbaceous plant to the Egyptian cropping system. No information is available on water requirements of chia crop under Egyptian conditions. A field experiment was conducted to determine the effect of irrigation treatments (IFarmer, IGrowth-stage, I120%ETo, I100%ETo, I80%ETo, and I60%ETo) on chia seed yield, plant height, total carbohydrates, total protein, total oil content, seed's nutrients, applied irrigation water (AIW), water productivity (WP), and yield response factor (Ky). Results showed significant effect of the irrigation treatments on all tested parameters. Average AIW values for the respective treatments were 8036 m3/ha, 7492 m3/ha, 6081 m3/ha, 5228 m3/ha, 4376 m3/ha and 3523 m3/ha. The highest average seed yield of 3.15 t/ha was recorded for I120%ETo treatment, while the lowest value of 2.00 t/ha was recorded for the I60%ETo treatment. The highest WP of 0.598 kg/m3 was recorded for I80%ETo. The Ky value of 0.78 was obtained. Therefore, applying appropriate agronomic management (e.g. proper amounts of irrigation water, and fertilizers through drip-fertigation technique) can achieve high chia seed yields. In case of water shortage, applying appropriate agricultural practices and I80%ETo can save 46% (3660 m3/ha) of AIW without significant reduction in seed yield.
Keywords: Chia, Applied irrigation water, water productivity, yield response factor, carbohydrates, protein, oil content, Egypt
INTRODUCTION
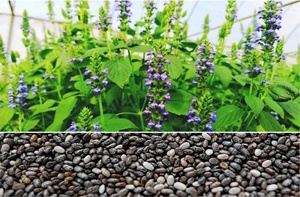
Chia (Salvia hispanica L.) crop is a new herbaceous plant introduced to the Egyptian cultivation system to enrich it with new varieties of medicinal and aromatic plants (Salman et al., 2019). It produces edible seeds and its economic value in the national and international market is very high. Chia seed has high nutritive and medicinal values, particularly rich in polyunsaturated fatty acids, omega-3 fatty acid or fish oil, high dietary fiber, protein, minerals, carbohydrates, protein, lipids, vitamins, and high level of antioxidants. Chia plants can grow in a wide range of well drained clay and sandy soils under all climatic conditions in rainfed and irrigated fields. It has reasonable salt and acid tolerance (Ayerza, 1995; Ixtaina et al., 2008; Ayerza and Coates, 2009; Amato et al., 2015; Bochicchio et al., 2015; Ullah, 2016; Singh and Verma, 2022).
Throughout the world, water scarcity is increasing in frequency, intensity and magnitude which pose threats to the food security of millions of people. To attain sustainable agriculture, a balance between conserving the water supply and ensuring food security should be considered. Coping with this major challenge requires proper strategies for crop management, implementing advanced technologies to help farmers optimize water use, and adopting policies that encourage farmers to conserve water (Evans and Sadler, 2008). One approach for ensuring diversity and water saving and reduce water scarcity problem is cultivating some areas of the high-water-demanding crops with more water-efficient crop such as chia crop (Hufnagel et al., 2020; Kirsch et al., 2024). Peperkamp (2015) stated that chia is a plant characterized by low water requirement and well adapted to arid and semiarid regions. The plants grow very well in sandy loam, well-drained soils with a low nutrient content, moderate salinity, and soil having pH of 6-8.5. The duration of chia crop cycle is from 140 to 180 days (Yeboah et al., 2014). Studies by Herman et al. (2016) showed diverse response of chia seed yield and water use efficiency (WUE) under deficit irrigation treatments in sandy loam soil. Results revealed that 20% deficit irrigation (80% ETo) did not affect chia yield. As for deficit irrigation (40–70% ETo), results showed reduction in chia seed yield and oil yield by 33 and 5%, respectively and increasing in WUE of oil yield by 27%. Results by Njoka et al. (2022) showed that high soil moisture content (89-93%) significantly increased chia vegetative growth and plant height increased by 65-180%, while 20-40% reduction of soil water decreased plant growth due to inhibition of cell enlargement or cell division.
In this study, we hypothesized that applying different amounts of irrigation water can considerably improve chia seed yield, chemical constituents and water productivity. As a new crop, there is no information available on water requirements of chia crop under Egyptian conditions. Therefore, the objectives of this field experiment were to determine the effect of irrigation treatments on chia seed yield, plant height, total carbohydrates (TC, %), total protein (TP, %), total oil content (%), macro-, secondary-, micro-nutrients, amounts of applied irrigation (AIW, m3/ha), water productivity (WP, kg seed/m3 applied water) and yield response factor (Ky).
MATERIALS AND METHODS
Experimental site description
A field experiment was conducted in a private farm (30o40’ N latitude, 32o15’ E longitude, and 10.0 m above mean sea level), Ismailia Governorate, Egypt, during the 2020/2021 and 2021/2022 winter growing seasons. The experimental site represents the newly reclaimed sandy soil of East Nile Delta region (Figure 1).
The site is characterized with cool winter with rare rainfall events. Mean monthly weather data at the experimental site for the period from 2015 to 2019 are presented in Table 1.
The data in Table 1 were used to calculate monthly reference evapotranspiration (ETo) values at the experimental site according to CROPWAT 8 model using the FAO-56 Penman-Monteith equation (Allen et al., 1998).
Samples from the upper 60 cm soil surface were collected at 15 cm interval to determine main soil physical parameters (particle size distribution, textural class and bulk density), hydro-physical constants (field capacity, wilting point, and available soil moisture) and some chemical properties (pH, ECe, and soluble cations and anions). Physical and chemical soil analyses were done according to the standard methods as described by Klute (1986) and Tan (1996). Soil samples were also analyzed for determining available macronutrients (N, P, and K) and the obtained values were 16.7, 5.5 and 65.1 mg kg−1, respectively. Accordingly, the soil was characterized by low fertility and insufficient available water for plant growth. As for irrigation water, samples were collected from Ismailia branch which supplies irrigation water to the farm and the chemical analysis is given in Table 2.
Experimental design and tested treatments
The field experiment was implemented in a strip plot design with four replicates. Irrigation treatments were laid out in the horizontal plots. The plots area was 700 m2.
The tested irrigation treatments were as follows:
• IF: Farmer treatment (control). The farmer applied irrigation and fertilizer amounts without interference from the researchers.
• IG: Applying water according to growth stages of chia crop.
According to BBCH scale description (Meier, 2018) and the specific growth stages defined for chia crop by Brandán et al. (2019), the growth stages (day) are: germination (10-15); leaf appearance (7-10); shoot appearance (7-10); inflorescence growth (7-10); flowering (25-30); fruit development (35-40); ripening (35-40); and senescence (30). In this treatment, applied irrigation water increased gradually from 100% ETo during germination to 140% ETo until mid-ripening stage, then decreased gradually to 120% ETo by the end of the season.
I120: Irrigation with amounts of water equal to 120% ETo.
I100: Irrigation with amounts of water equal to 100% ETo.
I80: Irrigation with amounts of water equal to 80% ETo
I60: Irrigation with amounts of water equal to 60% ETo
Irrigation treatments started 25 days from sowing chia seeds and stopped 5 days before harvest. Irrigation event was carried out every 3 days.
Cultural practices
Chia (Salvia hispanica L.) seeds were sown on 15 September of 2020 and 2021 winter seasons. Plants were harvested on 20 March 2023 and 2024. Seeds were banded under drip lateral lines spaced 30 cm apart between seeds and 30 cm apart between rows achieving plant density of 60,000 plants/ha. The crop was irrigated by a surface drip irrigation system. Fresh water from Ismailia branch was the source of irrigation water. The surface drip system consists of:
• Irrigation pump (60 hp) with discharge rate of 100 m3 h-1 ;
• Sand and screen filters and a venturi fertilizer injector. Fertilizers were applied in 80% of irrigation time (fertigation).
The conveying pipeline system consists of:
• 160 mm PVC main line;
• 110 mm PVC sub-main line;
• 50.8 mm PVC sub sub-main line.
The drip lateral lines of 16 mm diameter are connected to the sub sub-main line. Each lateral line is 24 m long spaced at 30 cm apart. The lateral lines were equipped with build-in emitters of 4 L h-1 discharge rate spaced at 0.30 m. Each lateral has 16 mm PE valve to control the application of irrigation water and the applied mineral fertilizers.
Macro and micro-nutrients were added through the irrigation water in 80% of irrigation time using the venture injector (fertigation technique). According to the findings of Taha (2012), all macronutrient fertilizers were added in equal doses (3 doses per week). The fertigation started 25 days from sowing in both growing seasons. Nitrogen fertilizer (ammonium nitrate, 33.5% N) was added at a rate of 120 kg N/ha, potassium fertilizer (potassium sulphate, 48% K2O) was added at a rate of 60 kg K2O/ha, and phosphorus was added at a rate of 80 kg P2O5/ha as phosphoric acid (60%). Micro-nutrients, i.e. Fe, Zn and Mn (EDTA, 13%), were also added 15 days before and during flowering at the rate of 600:600:600 g/ha using a regular hand sprayer. All other practices used for growing chia crop including weeds and pest management were followed.
The duration of the chia crop cycle in most cases ranges from 140 to 180 days (Coates and Ayerza, 1996). In our study, the crop cycle was 185 days.
Measurements of plant height and crop yield
Plant height (cm) growth attribute of chia crop was measured twice, from soil surface up to the top, after 45 and 60 days from sowing. At harvest time, all plants representing each treatment were collected to determine seed yield/plot and then yield/ha.
Chemical analysis
At harvest, samples from chia seeds were collected from all treatments to determine total carbohydrate (TC, %), crude fiber (CF, %), crude protein (CP, %), and oil content during 2021 and 2022 seasons. Total carbohydrate percentage was determined in plants using colorimetric method as described by Herbert et al. (1971).
As for crude protein, the nitrogen content of the collected samples was determined by Kjeldahl N (AOAC, 1999) and the value recorded for nitrogen was then multiplied by 6.25 to determine CP of the sample.
Irrigation water measurements and crop-water relations
The following parameters were considered in this study:
Applied irrigation water (AIW)
The amount of applied irrigation water was calculated according to the equation given by Vermeiren and Jopling (1984) as follows:
where:
AIW = applied irrigation water (m3).
ETo = reference crop evapotranspiration (mm/d).
Kr = ground cover reduction factor (= 0.7 according to Keller and Karmeli, 1975).
Iinterval = irrigation interval (3 days under experimental conditions).
A = irrigated area (m2)
Ea = irrigation efficiency = K1 x K2
where:
K1 = emitter distribution uniformity (= 0.89 and 0.91 in the 1st and 2nd seasons, respectively)
K2 = drip irrigation system efficiency (= 0.90 at the experimental site).
LR = leaching requirements (was not considered in this study to avoid the effect of excess leaching water on deficit irrigation treatments).
Yield response factor (Ky)
The yield response factor, which links relative yield decrease to relative applied irrigation water deficit, was expressed by the standard formulation given by Vaux and Pruitt (1983).
Crop water productivity (WP)
Crop water productivity, relates unit of crop yield to unit of water applied, was calculated according to Zhang (2003).
Statistical analysis
The obtained data were statistically analyzed according to (MSTAT-C) computer software package. Least significant differences (LSD) method was used to test the differences between treatment means at 5% level of probability as described by Snedecor and Cochran (1980).
RESULTS AND DISCUSSION
Reference crop evapotranspiration (ETo)
The calculated reference evapotranspiration (ETo) values at the experimental site during the growing seasons are illustrated in Figure 2. Results indicated that, the ETo value for irrigation season (15 Sep. – 20 Mar.) was 439 mm. Results presented in this figure show that, the highest mean ETo values were 4.7 and 4.2 mm/day during September and March, respectively. The lowest mean ETo values were 2.4 and 2.1 mm/day during the winter months of December and January, respectively.
Effect on applied irrigation water (AIW)
Results in Table 3 show the effect of tested irrigation treatments on amounts (m3/ha) and the savings in applied irrigation water (%) to chia crop. The 2-year average AIW values were 8036 m3/ha, 7492 m3/ha, 6081 m3/ha, 5228 m3/ha, 4376 m3/ha and 3523 m3/ha for the farmer practice, irrigation according to growth stage, 120%, 100%, 80%, and 60% ETo treatments, respectively. It is clear from the results that amounts of AIW in the first season were higher than the amounts in the second season due to the lower application efficiency (Ea) of 80% in the 1st season and higher application efficiency of 82% in the 2nd season. The 2-yrs. average water saved were 7, 24, 35, 46 and 56% for the respective treatments less than farmer practice. The obtained results reflect the need of extension services to the farmers growing newly cultivated crops such as chia crop to avoid excess of irrigation water, reduce the cost of fertilizers added and energy used for irrigation and to decrease the negative effect on crop yield. The obtained results were higher than those reported by Harisha et al. (2024) who stated that average supplied irrigation water for chia crop of 2042 and 3433 m3/ha were recorded for I50% and I100% irrigation treatments, respectively. The differences in amounts of water applied could be due to climate parameters, soil type and length of growing season.
Effect on chia seed yield and water productivity
Results indicated that chia seed yields were significant affected by irrigation treatments in the two growing seasons. The highest 2-yrs average seed yield of 3.15 t/ha was recorded for the 120% ETo treatment, while the lowest value of 1.99 t/ha was recorded for the 60% ETo treatment (Table 4). Results showed that seed yields of the 2nd seasons were higher than seed yields of the 1st season. Also, there were no significant differences between seed yields recorded for IF, IG, I120%, I100% and I80% treatments in the 2nd season. The obtained result can be explained by the fact that application efficiency (Ea) of irrigation water was higher in the 2nd season with direct effect on improving fertilizer application efficiency and increasing seed yields. Also, it could be stated that, applying appropriate agronomic conditions (e.g. proper amounts of irrigation water, and applying fertilizer by fertigation technique) can achieve high chia seed yields. From the obtained results of the 2nd season it could be recommended, in case of water shortage, that applying good agricultural practices can save 46% of applied irrigation water (I80%ETo) without significant reduction in chia seed yield. The obtained seed yields were close to what was reported by Yeboah et al. (2014) and Sosa et al. (2017). They reported that the maximum attainable seed yield of chia crop is close to 3.0 t/ha. The results were also close to those reported by Harisha et al. (2023), who concluded that deficit irrigation at I25%, I50% and I75% led to 3.3, 20.1 and 55.3% reductions in seed yield.
A second order polynomial equation was used to explain the association between seed yields (t/ha) and applied irrigation water (m3/ha) for all tested treatments. The obtained 2nd order degree polynomial equation explaining seed yield – AIW relation is illustrated in Figure 3 and expressed as:
The coefficient of determination value (r2 = 0.8259) indicates that the developed relation can effectively explain the relation between seed yields and applied irrigation water.
Results in Table 4 showed also that water productivity values increased with decreasing amounts of applied irrigation water, except for the I60%ETo treatment. The 2-yrs. average WP values varied between 0.343 and 0.598 kg seeds/m3. The highest WP for seeds was recorded for I80%ETo (0.598 kg/ m3), followed by I60%ETo (0.565 kg/ m3), I100%ETo (0.552 kg/m3), I120%ETo (0.518 kg/m3), and the lowest values were recorded for IG (0.404 kg/m3) and IF (0.343 kg/m3). The obtained results were close to those reported by Tezara et al. (2002), who indicated that deficit irrigation improved the WP to the extent of 12.8, 25.4 and 17.5% at severe (I25), moderate (I50) and mild (I75) stress conditions, respectively, compared to no stress (I100). Results can be also explained by the statement of Harisha et al. (2023) who indicated that, the increase in WP in the less amounts of applied water treatments could be due to increasing net assimilation or decreasing transpiration.
Effect on yield response factor (Ky)
The relation between relative yield reduction and relative reduction in applied irrigation water (i.e. Ky) is illustrated in Figure 4. The linear equation governing this relation is expressed as:
where:
Y: represents relative yield reduction (1 – Ya/Ym). In this study, Ym represents the yields obtained from I120% ETo treatment, while Ya represents the yields obtained from I100% ETo, I80% ETo, and I60% ETo treatments.
X: represents relative reduction in applied irrigation water (1 – AIWa/AIWm). The AIWm represents the applied irrigation water for the I120%ETo treatment, while AIWa represents the applied irrigation water for the I100%ETo, I80%ETo, and I60%ETo treatments.
The constant 0.7803 represents the crop response factor (Ky) under the experimental conditions. Since Ky value is less than 1.0, the chia crop can be considered as moderately tolerant to deficit irrigation and the relative reduction in yield is less than the relative reduction in applied water. The coefficient of determination (r2) value of 0.9226 indicates that the developed relation can predict with high confidence level the relative yield reduction due to relative reduction in applied irrigation water at the experimental site and other locations with similar conditions.
Effect on plant height, total carbohydrates, total protein and oil percentage
Results in Table 5 showed significant effect of the tested irrigation treatments on plat height, total carbohydrates, total protein and oil percent in the two seasons. The highest plant height values of 60.2 and 62.0 cm after 45 days and 88.2 and 90.0 cm after 60 days from sowing were recorded for IG treatment in the 2020/21 and 2021/22 seasons, respectively. The lowest values of 42.0 cm (30.3% reduction) and 44.0 cm (29% reduction) after 45 days and 65.4 cm (25.9% reduction) and 66.6 cm (26% reduction) after 60 days from sowing were recorded for I60% treatment in the 2020/21 and 2021/22 seasons, respectively. Results showed that, decreasing amounts of applied water significantly reduced plant growth. The obtained results were close to those reported by El-Serafy et al. (2020) who indicated that chia plant height varied between 47 and 67 cm. Also, the results were in line with those of Harisha et al. (2024), who reported that irrigation levels significantly influenced the plant height of chia crop since deficit irrigation (I50) reduced the plant height by 9.6, 14.4 and 11.0% at 30, 60 and 90 days after sowing, respectively as compared to 100% irrigation treatment (I100). Results of this research were similar to those given by Soliman et al. (2024) who showed that plant heights were 51.1 and 69.5 cm.
Results revealed that the highest carbohydrates (%) values of 59.4 and 61.3% were recorded for IG treatment in the 2020/21 and 2021/22 seasons, respectively. The lowest values of 34.8 and 36.3% were recorded for the I60% treatment in the 2020/21 and 2021/22 seasons, respectively (Table 5). The obtained results were within the range of carbohydrate values reported by Ixtaina et al. (2008 and 2011) who stated that carbohydrate contents of chia seeds varied from 26 to 41%. The results were similar to carbohydrate content of 42.1% as reported by USDA (2018).
Protein contents (%) were significantly affected by irrigation treatments (Table 5). Results showed that, the highest protein content (%) values of 11.7 and 12.9% were recorded for IG treatment in the 2020/21 and 2021/22 seasons, respectively. The lowest values of 7.1 and 7.4% were recorded for the I60% treatment in the 2020/21 and 2021/22 seasons, respectively. The obtained results were close to chia seed protein values of (15 - 25%) as reported by Ixtaina et al. (2008 and 2011), (18.2 – 25.3%) as reported by da Silva et al. (2014 and 2017), 16.5% as reported by USDA (2018), and 17.1% as reported by Varban et al. (2022).
Results in Table 5 indicated that oil contents (%) in chia seeds were significantly influenced by irrigation treatments. The highest oil content (%) values of 14.6 and 15.1% were recorded for IG treatment in the 2020/21 and 2021/22 seasons, respectively. Oil contents of the IF, I120%, I100%, I80%, I60% treatments were 23.7, 10.2, 18.5, 31.8, and 41.4% less than IG treatment, respectively. The lowest values of 8.6 and 8.9% were recorded for the I60% treatment in the 2020/21 and 2021/22 seasons, respectively. The reduction in oil content is directly related to the reduction in seed yield. The obtained results were similar to the oil contents in chia seeds reported by El-Serafy et al. (2020) who indicated that oil content varied between 15 and 13% for 15 Sep. and 1 Oct. sowing dates, respectively. The obtained results were also close to the results reported by Harisha et al. (2023) who stated that deficit irrigation at I25%, I50%, and I75% led to 42.5, 22.5 and 4.2% reduction in oil yield compared to I100%.
Generally, the obtained results were in line with those reported by Furtado et al. (2016) who stated that plant growth reduction and accumulation of dry matter under deficit irrigation could be attributed to the decrease in water and nutrient uptake due to stomata closure, poor transpiration and low turgor pressure, which reduced photosynthesis and cell expansion.
Effect on macro-, secondary-, and micro-nutrients
Results in Tables 6 and 7 indicated significant effect of irrigation treatments on the measured macro-, secondary, and micro-nutrients in chia seeds. Results in Table 6 revealed that, the highest nitrogen values of 1.87 and 2.07% were recorded for IG treatment, while the lowest values of 1.15 and 1.19% were recorded for I60% treatment in the 1st and 2nd seasons, respectively. The obtained results were close to N% value of 2.98% as reported by Abd Elhamed and Abd El-Khalek (2022). The highest P (%) values of 0.32 and 0.31% were recorded for IG treatment, while the lowest values of 0.17 and 0.18% were recorded for I60% treatment in the 1st and 2nd seasons, respectively. The obtained results were close to P% value of 0.45% as reported by Abd Elhamed and Abd El-Khalek (2022). The highest potassium (%) values of 0.73 and 0.75% were recorded for IG treatment, while the lowest values of 0.43 and 0.44 % were recorded for I60% treatment in the 1st and 2nd seasons, respectively. The results of this study were close to K (%) values of 0.66-0.81% as reported by ESFA (2009), 0.73 % as reported by Jin et al. (2012), 0.41 % as reported by USDA (2018), and 0.32-0.53 % as reported by Mohamed et al. (2019). The highest Ca (%) values of 0.57 and 0.59 % were recorded for IG treatment, while the lowest values of 0.44 and 0.45% were recorded for I60% treatment in the 1st and 2nd seasons, respectively. The obtained Ca (%) values were in close agreement with those reported by EFSA (2009) of 0.50-0.77%, Jin et al. (2012) of 0.46 %, USDA (2018) of 0.63%, and Mohamed et al. (2019) of 0.57-0.59 %. The highest Mg (%) values of 0.44 and 0.45 % were recorded for IG treatment, while the lowest values of 0.26 and 0.27 % were recorded for I60% treatment in the 1st and 2nd seasons, respectively. The obtained Mg (%) values in this study were in line with those reported by EFSA (2009) of 0.32-0.40 %, Jin et al. (2012) of 0.45%, USDA (2018) of 0.33 %, and Mohamed et al. (2019) of 0.29-0.30%.
Results in Table 7 showed that, the highest Mn values of 51.1 and 52.7 ppm were recorded for IG treatment, while the lowest values of 29.9 and 31.0 ppm were recorded for I60% treatment in the 1st and 2nd seasons, respectively. The obtained results were in line with Mn value of 37.9 ppm as reported by Jin et al. (2012). The obtained values were higher than Mn (ppm) value of 27 ppm as reported by USDA (2018). The highest Zn (ppm) values of 76.9 and 80.1 ppm were recorded for IG treatment, while the lowest values of 45.5 and 47.1 ppm were recorded for I60% treatment in the 1st and 2nd seasons, respectively. The results of this study were close to Zn (ppm) values of 37-79 ppm as reported by ESFA (2009), 64.7 ppm as reported by Jin et al. (2012), 46 ppm as reported by USDA (2018), and 37.6-51.9 ppm as reported by Mohamed et al. (2019). The highest Fe (ppm) values of 86.4 and 89.3 ppm were recorded for IG treatment, while the lowest values of 50.6 and 52.4 ppm were recorded for I60% treatment in the 1st and 2nd seasons, respectively. The results of this study were close to Fe (ppm) values of 63-99 ppm as reported by ESFA (2009), 91.8 ppm as reported by Jin et al. (2012), 77 ppm as reported by USDA (2018), and 53.9-0.71 ppm as reported by Mohamed et al. (2019). The highest B (ppm) values of 38.0 and 39.2 ppm were recorded for IG treatment, while the lowest values of 22.2 and 23.0 ppm were recorded for I60% treatment in the 1st and 2nd seasons, respectively. The obtained B (ppm) values were higher than those reported by Abd Elhamed and Abd El-Khalek (2022) of 18.7-20.0 ppm. The highest Cu (ppm) values of 7.22 and 7.23 ppm were recorded for IG treatment, while the lowest values of 4.28 and 4.25 ppm were recorded for I60% treatment in the 1st and 2nd seasons, respectively. The obtained Cu (ppm) values in this study were in line with those reported by EFSA (2009) of 2.0-19.1 ppm, USDA (2018) of 9.0 ppm and Mohamed et al. (2019) of 7.48-9.36 ppm.
Results showed that there were no significant differences between all measured macro- and secondary-nutrients (%) for IG and I120% treatments in the two seasons. Also, all measured values of macro- and secondary-nutrients (%), and micro-nutrients (ppm) were higher in the 2nd season compared with the 1st season. These results were due to higher irrigation application efficiency value in the 2nd season with direct effect on improving the availability and uptake of fertilizers injected through fertigation technique. Results also indicated that decreasing the amounts of applied water (i.e. I100%ETo, I80%ETo and I60%ETo) decreased nutrient contents in chia seeds. The obtained results can be explained as nutrient availability may be limited since the decrease of soil moisture delays minerals’ dissolution and reduces the concentration in soil solution, while adequate moisture (i.e. IG and I120%ETo) ensures nutrients distribution uniformity and uptake. Excess irrigation (i.e. IF) led to nutrients leaching from the root zone with direct effect on uptake and plant growth.
CONCLUSION
Chia (Salvia hispanica L.) crop is a new herbaceous plant introduced to the Egyptian cultivation system. No information is available on water requirements of chia crop under these conditions. Results indicated significant effect of irrigation treatments on chia seed yield, plant height, total carbohydrates, total protein, total oil content, macro-, secondary-, micro-nutrients, amounts of applied irrigation and water productivity. Results showed significant effect of the irrigation treatments on all tested parameters. Chia crop response factor was 0.78 indicating moderately tolerant to deficit irrigation. From the obtained results it could be concluded that applying appropriate agronomic conditions (e.g. proper amounts of irrigation water, and applying fertilizer through drip-fertigation technique) can achieve high chia seed yields. In case of water shortage, applying good agricultural practices and I80%ETo can save 46% (3660 m3/ha) of applied irrigation water without significant reduction in chia seed yield.
REFERENCES
AOAC (1999). Association of official analytical chemists, Official Methods of Analysis 13th Ed. Washington, D.C.
Abd Elhamed Reham S., Sarah N. Abd El-Khalek (2022). Role of some micronutrients in improving productivity and quality of seeds in chia plants (Salvia Hispanica L.) in sandy soil. Scientific J. Flowers & Ornamental Plants, 9: 343-361.
Allen R.G., L.S. Pereira, D. Raes, M. Smith (1998). Crop evapotranspiration-Guidelines for computing crop water requirements. FAO Irrigation and drainage paper 56. FAO, Rome.
Bochicchio R., T.D. Philips, S. Lovelli, R. Labella, F. Gal-gano, A. Di Marisco, M. Amato (2015). Innovative crop productions for healthy food: the case of chia (Salvia hispanica L.). The sustainability of agro-food and natural resource systems in the Mediterranean basin, 2015, p. 29-45.
Brandán J.P., R.N. Curti, M.M. Acreche (2019). Phenological growth stages in chia (Salvia hispanica L.) according to the BBCH scale. Scientia Horticulture, 255: 292–297.
Amato M., M.C. Caruso, F. Guzzo, F. Galgano, M. Commisso, R. Bochicchio, R. Labella, F. Favati (2015). Nutritional quality of seeds and leaf metabolites of Chia (Salvia hispanica L.) from Southern Italy. Eur. Food Res. Technol., 241: 615–625.
Ayerza R. (1995). Oil content and fatty acid composition of chia (Salvia hispanica L.) from five north-western locations in Argentina. J. Am. Oil Chem. Soc., 72: 1079–1081.
Ayerza R., W. Coates (2009). Influence of environment on growing period and yield, protein, oil and α-linolenic content of three chia (Salvia hispanica L.) elections. Industrial Crop Products, 30: 321-324.
Coates W., R. Ayerza (1996). Production potential of chia in Northwestern Argentina. Ind. Crop Prod., 5: 229-233.
da Silva B.P., P.C. Anunciação, J.C.M. da Silva, C.M. Della Lucia, H.S.D. Martino, H.M. Pinheiro-Sant’Ana (2017). Chemical composition of Brazilian chia seeds grown in different places. Food Chemistry, 221: 1709–1716.
da Silva M.R., E. Aguiar Moraes, L.S. Alves, G.A. Teixeira, E.M. Nogueira, M.R. Maróstica Jr. (2014). Chemical characterization and antioxidant potential of Chilean chia seeds and oil (Salvia hispanica L.). LWT - Food Science and Technology, 59: 1304–1310.
EFSA (European Food Safety Authority) (2009). Scientific opinion of the panel on dietetic products nutrition and allergies on a- Request from the European Commission on the Safety of ‘chia seed (Salvia hispanica L.) and ground whole chia seed’ as a food ingredient. EFSA. J., 996: 1-2.
El-Serafy Rasha S., A.A. El-Sheshtawy, H.E. Ali (2020). Phenology, architecture, yield and fatty acid content of chia in response to sowing date and plant spacing. 10th International Conference for Sustainable Agricultural Development 2-4 March 2020. Fayoum J. Agric. Res. & Dev., 34: 314-331.
Evans R.G., E.J. Sadler (2008). Methods and technologies to improve efficiency of water use. Water Resour. Res., 44: 1–15.
Furtado G.F., D.A. Xavier, E.M.G. Andrade, G.S. de Lima, L.H.G. Chaves, A.C.F. de Vasconcelos, J.A.C. Wanderley (2016). Growth and physiological responses of sunflower grown under levels of water replacement and potassium fertilization. Afr. J. Agric. Res., 11: 1273–1281.
Harisha C.B., J. Rane, G.R. Halagunde Gowda, S.B. Chavan, A. Chaudhary, A.K. Verma, Y. Ravi, H. Asangi, H.M. Halli, K.M. Boraiah (2024). Effect of deficit irrigation and intercrop competition on productivity, water use efficiency and oil quality of chia in semi-arid regions. Horticulturae, 10: 101-1024.
Harisha C.B., V.B. Narayanpur, J. Rane, V.M. Ganiger, S. Prasanna, Y.C. Vishwanath, G.S. Reddi, H.M. Halli, K.M. Boraiah, P.S. Basavaraj (2023). Promising bioregulators for higher water productivity and oil quality of chia under deficit irrigation in semiarid regions. Plants, 12: 662-684.
Herbert D., P.J. Philipps, R.E. Strange (1971). Determination of total carbohydrates. Methods in Microbiology, 5: 290-344.
Herman S., G. Marco, B. Cecilia, V. Alfonso, M. Luis, V. Cristián, P. Sebastián, A. Sebastián (2016). Effect of water availability on growth, water use efficiency and omega 3 (ALA) content in two phenotypes of chia (Salvia hispanica L.) established in the arid Mediterranean zone of Chile. Agric. Water Manag., 173: 67–75.
Hufnagel J., M. Reckling, F. Ewert (2020). Diverse approaches to crop diversification in agricultural research. Agron. Sustain. Dev., 40: 1–17.
Ixtaina V.Y., M. Nolasco Susana, M.C. Tomás (2008). Physical properties of chia (Salvia hispanica L.) seeds. Industrial Crops and Products, 28: 286-293.
Ixtaina V.Y., M.L. Martínez, S. Viviana, Carmen M. Mateo, D.M. Maestri, B.W.K. Diehl, Susana M. Nolasco, M.C. Tomás (2011). Characterization of chia seed oils obtained by pressing and solvent extraction. Journal of Food Composition and Analysis, 24: 166-174.
Jin F., D.C. Nieman, W. Sha, G. Xie, Y. Qiu, W. Jia (2012). Supplementation of milled chia seeds increases plasma ALA and EPA in postmenopausal women. Plant Foods Hum. Nutr., 2012, 67: 105–110.
Keller J., D. Karmeli (1975). Trickle irrigation design. Rain bird International.
Kirsch B., J.B. Fisher, T. Piechota, M. Hassani, D.C. Suardiaz, R. Puri, J. Cahill, H.S. Atamian (2024). Satellite observations indicate that chia uses less water than other crops in warm climates. Communications Biology, 7:1225.
Klute A. (1986). Methods of Soil Analysis, part 1. Physical and mineralogical method. American Society of Agronomy, Madison, Wisconsin.
Meier U. (2018). Growth stages of mono- and dicotyledonous plants: BBCH monograph. Quedlinburg DE: Julius Kühn-Institut.
Mohammed O.B.R., Amal M. Abd El-Razek, Mona H.H. Bekhet, Y.G. Moharram (2019). Evaluation of Egyptian chia (Salvia hispanica L.) seeds, oil and mucilage as novel food ingredients. Egypt. J. Food. Sci., 47: 11- 26.
Njoka M.; Mwenda Cynthia M., P. Masinde (2022). Influence of varying soil moisture on growth and yield of Chia (Salvia hispanica l.) in Meru County, Kenya. African Journal of Science, Technology and Social Science, 2: 26-35.
Peperkamp M. (2015). CBI Tailored Intelligence: chia from Bolivia a modern super seed in a classic port cycle? CBI Ministry of Foreign Affairs report. The Hague, Netherlands, 16.
Salman A.M., E.A. Omera, M.S. Husseina, Eman Sewedan, Amira R. Osman (2019). Influence of foliar fertilization on the growth and yield of chia (Salvia hispanica) plant. Egyptian Pharmaceutical Journal, 18: 263–275.
Singh Arti, A.K. Verma (2022). A review on the potential use and cultivation of chia seeds (Salvia Hispanica L.) in India. International Journal of Trend in Scientific Research and Development (IJTSRD), 6: 1265-1271.
Snedecor G.W., W.G. Cochran (1980). Statistical Methods, 6th Ed. Iowa State Univ. Press, Ames, Iowa, USA, 507 p.
Soliman W.S., S.F. Hendawy, A.M. Abbas, S. Salaheldin, Shimaa M. Esmail (2024). Bio-stimulants as alternatives to mineral fertilizers: influence on chia (Salvia hispanica L.) growth, yield, and fatty acid composition. Not. Bot. Horti. Agrobo., 52: Art. no. 13445.
Sosa B.A., G. Ruiz-Ibarra, J. Rana, G. Gordillo-Sobrino, H. West (2017). Fecha de siembra: un método para evadir el ataque de Diabrotica speciosa Germar, 1824 (Coleoptera: Chrysomelidae) y aumentar el rendimiento de semilla en chía (Salvia hispanica L.). Entomología Mexicana, 3: 277-284.
Taha A.M. (2012). Effect of climate change on maize and wheat grown under fertigation treatments in newly reclaimed soil. PhD Thesis, Tanta University, Egypt.
Tan K.H. (1996). Soil sampling, preparation and analysis. New York (NY): Marcel Dekker. Brockhaus, F. A. 1962. A B C der land wirtscheft B. and A-K 2nd Edit VEB F. A. Brockhaus Verlay, Leipzg.
TezaraW., V. Mitchell, S.P. Driscoll, D.W. Lawlor (2002). Effects of water deficit and its interaction with CO2 supply on the biochemistry and physiology of photosynthesis in sunflower. J. Exp. Bot., 53: 1781–1791.
Ullah R. (2016). Nutritional and therapeutic perspectives of Chia (Salvia hispanica L.): a review. J. Food Sci. Technol., 53: 1750–1758.
USDA National Nutrient Database for Standard Reference, Release 28. (2018). Available online: http: //www.ars.usda.gov/ba/bhnrc/ndl
Varban R., I. Crisan, D. Varban, C. Muresan, A. Ghete, A. Stoie, A. Ona (2022). Cultivation potential of chia (Salvia hispanica L.) in Cluj county. Series A. Agronomy, LXV: 583-592.
Vaux H.J., D.W. Pruitt (1983). Crop water production functions. In D. Hillel (ed.) Advances in Irrigation. 2: 61-93, Academic Press, NY, USA.
Vermeiren L., G.A. Jopling (1984). Localized Irrigation. FAO, Irrigation and Drainage Paper no. 36, Rome, Italy.
Yeboah S., E. Owusu Danquah, J.N.L. Lamptey, M.B. Mochiah, S. Lamptey, P. Oteng-darko, I. Adama, Z. Appiah-Kubi, K. Agyeman (2014). Influence of planting methods and density on performance of Chia and its suitability as an oilseed plant. Agricultural Science, 2: 14-26.
Zhang H. (2003). Improving water productivity through deficit irrigation: Examples from Syria, the North China Plain and Oregon, USA. In Water Productivity in Agriculture: Limits and opportunities for Improvement (Eds. J.W. Kijne, R. Barker and D. Molden), pp. Wallingford, UK, and Colombo, CABI Publishing and International Water Management Institute.