Abstract
The sustainable management of soil fertility, particularly micronutrients, is critical for enhancing crop productivity and nutritional quality in West Africa. This study employed geostatistical techniques and a Geographic Information System (GIS) to assess the status and spatial distribution of available Zinc (Zn), Copper (Cu), Manganese (Mn), and Iron (Fe), alongside soil pH, across 70 sampling points in Kura Local Government Area (LGA), Kano State, Nigeria. Descriptive statistics revealed high coefficients of variation (CV) for all micronutrients, indicating significant spatial heterogeneity and the inadequacy of uniform fertilizer application. Semivariogram analysis confirmed a strong to moderate spatial dependence for all elements, allowing for reliable spatial interpolation via Kriging. The resulting maps delineated distinct zones of deficiency, sufficiency, and potential excess for each micronutrient. While mean values suggested generally high levels of Fe, Mn, and Zn, the spatial maps highlighted localized areas where targeted management is essential to prevent both deficiency-induced yield loss and potential toxicity. The findings underscore the necessity of adopting Precision Agriculture strategies in Kura LGA, providing a critical foundation for developing site-specific nutrient management plans to optimize crop production and soil health.
Keywords: Geostatistics, kriging, precision agriculture, DTPA extraction, spatial interpolation, nutrient mapping
INTRODUCTION
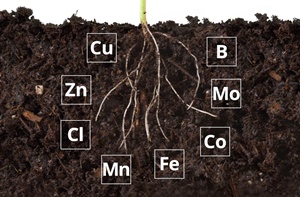
Micronutrients, including Zinc (Zn), Copper (Cu), Manganese (Mn), and Iron (Fe), are essential for optimal plant growth and play a critical role in human nutrition, with deficiencies linked to widespread health issues globally (Abubakar et al., 2022; Adamu et al., 2021). In the context of West African agriculture, particularly in Nigeria, soil fertility degradation presents a major challenge to achieving food security and sustainable intensification (Adhikari and Hartemink, 2016). Continuous cultivation without adequate nutrient replenishment, coupled with the inherent properties of tropical soils, has led to significant imbalances in both macro- and micronutrient availability (Adugna and Abegaz, 2020; Abdulkadir et al., 2025b).
The northern region of Nigeria, characterized by the Sudan Savannah ecological zone, is a major food production area. Kura Local Government Area (LGA) in Kano State is a prominent agricultural hub, renowned for its intensive rice cultivation and other staple crops (Alemayehu et al., 2023). Despite its agricultural importance, the soil fertility management in Kura LGA, like much of the region, often relies on conventional, uniform fertilizer application strategies.
This “blanket” approach is fundamentally flawed because soil properties, including nutrient concentrations, exhibit a high degree of spatial variability, even over short distances (Ayoola et al., 2021). Applying a single recommendation across a heterogeneous field inevitably leads to over-fertilization in some areas (resulting in economic loss and environmental pollution) and under-fertilization in others (leading to yield gaps and nutrient-poor crops) (Bhunia et al., 2018).
To address this critical limitation, a shift towards Precision Agriculture is necessary. This approach requires a detailed, spatial understanding of soil nutrient distribution. Geostatistics, integrated with a Geographic Information System (GIS), provides the robust analytical framework needed to quantify this spatial variability, model the continuous distribution of soil properties from discrete sample points, and delineate site-specific management zones (Arunkumar and Paramasivan, 2015; Sani et al., 2022; Sani et al., 2023).
Previous studies in the region have highlighted the general problem of micronutrient deficiencies (FAO, 2006), but a comprehensive, geostatistical assessment focusing specifically on the available forms of Zn, Cu, Mn, and Fe in the intensively farmed soils of Kura LGA has been lacking.
Therefore, the objectives of this study were to characterize the spatial variability of these micronutrients using geostatistical techniques (semivariogram modeling and Kriging) and to generate high-resolution spatial distribution maps that can be used to delineate site-specific management zones for precision fertilizer application, thereby promoting sustainable soil fertility and enhancing crop productivity in the rice paddies of Kura LGA in Kano state, Nigeria.
MATERIAL AND METHODS
Study Area
The study was conducted in Kura Local Government Area (LGA) of Kano State, Nigeria. Kura LGA is situated within the Sudan Savannah ecological zone, characterized by a distinct wet and dry season. The area is predominantly agricultural, with major crops including rice, maize, and vegetables. The underlying geology and climatic conditions contribute to the specific soil types and fertility status observed in the region.
Soil Sampling
A total of 70 composite soil samples were collected from the agricultural farmlands of Kura LGA. A systematic grid sampling approach was employed to ensure adequate spatial coverage of the study area. At each sampling point, soil was collected from the topsoil layer (0–20 cm depth). The samples were air-dried, crushed, and sieved through a 2 mm sieve before being subjected to laboratory analysis.
Laboratory Analysis
Soil pH was measured in a 1:2.5 soil-to-water suspension using a glass electrode pH meter as described in IITA (2015). Available Micronutrients (Mn, Zn, Fe, and Cu) were extracted using the DTPA (diethylenetriaminepentaacetic acid) extraction method as described by Lindsay and Norvell (1978). Specifically, 10 g of soil was shaken with 20 mL of 0.005 M DTPA solution containing 0.01 M CaCl2 and 0.1 M triethanolamine (TEA) adjusted to pH 7.3 for 2 hours. The extract was filtered, and the concentrations of the micronutrients were measured using an Atomic Absorption Spectrophotometer (AAS). The obtained concentrations were interpreted based on established critical limits (Gee and Bauder, 1986).
Soil Fertility Classification
The interpretation of analytical results for soil fertility assessment was based on established critical limits and fertility rating standards as recommended by the Food and Agriculture Organization (FAO, 2006; Hendershot et al., 2008), the International Institute of Tropical Agriculture (IITA, 2015), and the Federal Ministry of Agriculture and Rural Development (FMARD, 2020; ISRIC, 2020). These standards provide scientifically validated threshold values for categorizing the nutrient status of soils into low, medium, or high fertility levels.
Statistical and Geostatistical Analysis
The data generated from laboratory analyses were subjected to both statistical and geostatistical analyses. Descriptive statistics, including the mean, minimum, maximum, standard deviation (SD), and coefficient of variation (CV), were computed for all soil parameters. The CV was used to categorize the variability of soil properties as low (CV < 15%), moderate (15–35%), or high (CV > 35%) (Wilding, 1985). Descriptive statistical analyses were performed using Jamp statistical software. The spatial distribution maps were developed to visualize the variation of key soil properties across the study locations. The maps were classified according to the fertility rating standards to delineate soil fertility zones. All spatial maps were prepared using ArcGIS 10.8 and georeferenced to the WGS 84 coordinate system.
RESULTS AND DISCUSSION
Descriptive Statistics of Soil Properties
The descriptive statistics for soil pH and available micronutrients (Zn, Cu, Mn, and Fe) are presented in Table 1. A total of 70 soil samples were analyzed.
The soil reaction was slightly acidic to near-neutral, with a mean pH of 6.01 and a low coefficient of variation (CV) of 4.70%. This narrow range suggests a relatively uniform soil acidity across the study area which is in accordance with findings of Abdulkadir et al. (2022) and (2025a). In contrast, the available micronutrients exhibited high spatial variability, as indicated by their high CV values. Zinc (Zn) showed the highest variability with a CV of 68.9%, followed by Iron (Fe) at 31.6%, Copper (Cu) at 30.3%, and Manganese (Mn) at 28.6%. According to the classification by Wilding (1985), all four micronutrients fall into the highly variable category (CV>35%) or moderately variable category (15–35%), confirming the necessity of a geostatistical approach to accurately map their distribution.
The mean concentrations of the micronutrients were found to be: Zn (13.2 mg/kg), Cu (2.01 mg/kg), Mn (26.1 mg/kg), and Fe (170 mg/kg). When compared to common critical levels for DTPA-extractable micronutrients (e.g., Zn: 0.8 mg/kg; Cu: 0.2 mg/kg; Mn: 1.0 mg/kg; Fe: 2.5 mg/kg) (Lindsay and Norvell, 1978), the mean values suggest that the soils of Kura LGA are generally well-supplied or even excessive in all four micronutrients. The extremely high mean concentration of Fe (170.21 mg/kg) is particularly noteworthy. However, the minimum values for Zn (0.74 mg/kg) indicate that some localized areas may still be deficient, further justifying the need for spatial mapping.
Spatial distribution of available micronutrients
The successful application of geostatistical techniques (semivariogram modeling and Kriging) allowed for the creation of continuous spatial distribution maps for each micronutrient (Figures 2–5). The spatial dependence observed for all micronutrients confirms that their distribution is not random but is influenced by intrinsic soil-forming factors and management practices, which can be effectively modeled (Sharu et al., 2020).
Spatial Distribution of Zinc (Zn)
The spatial map for Zn (Figure 2) shows that the majority of the study area falls within the high concentration range (10.01–25 mg/kg). This is consistent with the high mean value (13.2 mg/kg). However, the map clearly delineates a small area in the western part of the LGA where Zn concentrations are below 10 mg/kg, suggesting a potential localized deficiency or a lower-end sufficiency zone. The high overall Zn status may be linked to the near-neutral pH, which generally reduces Zn availability (Abdulkadir et al., 2020; Dawaki et al., 2020), or to the parent material of the soil.
Spatial distribution of manganese (Mn)
The spatial distribution of Mn (Figure 3) is highly heterogeneous, with a significant portion of the area classified as low (<22 mg/kg) and other large areas in the high range (>25.0 mg/kg). This patchy distribution highlights the strong spatial variability (CV 28.6%) and the risk of both Mn deficiency and potential toxicity across the LGA. The availability of Mn is highly sensitive to redox conditions and pH, suggesting that localized differences in drainage or organic matter content may be driving this pattern.
Spatial distribution of iron (Fe)
The spatial map for Fe (Figure 4) shows that almost the entire study area is in the low concentration range (<140 mg/kg) according to the map’s classification, despite the extremely high mean value (170 mg/kg). This apparent contradiction suggests that the classification thresholds used in the map legend may be unusually high, or that the Fe is present in forms that are not readily available, even to the DTPA extractant. Given the high mean, the map effectively highlights the areas with the lowest Fe concentration relative to the overall high background. The small, isolated spots of higher concentration (140–250 mg/kg) indicate micro-sites of Fe accumulation.
Spatial distribution of copper (Cu)
The spatial distribution of Cu (Figure 5) shows a clear division between areas of moderate (1.88–2 mg/kg) and high (>2.01 mg/kg) concentration. The mean Cu concentration (2.01 mg/kg) places the soil in the high-sufficiency range which is in accordance with the findings of Adesoji et al. (2025). The map is crucial for identifying the areas where Cu levels are at the lower end of the sufficiency range, which could become deficient under intensive cropping or in response to other nutrient applications.
Implications for Precision Agriculture
The results unequivocally demonstrate that the soil fertility status of Kura LGA, with respect to micronutrients, is characterized by high spatial variability. This finding invalidates the use of blanket fertilizer recommendations, which would either over-apply nutrients in high-concentration zones (leading to waste and potential toxicity) or under-apply in low-concentration zones (leading to yield loss). The generated spatial maps provide the necessary information to delineate site-specific management zones. For instance, areas with Zn concentrations below 10 mg/kg (Figure 2) should be prioritized for Zn fertilization, while the vast areas with high Fe and Mn concentrations require no application and may warrant management strategies to mitigate potential toxicity or antagonism with other nutrients. By adopting a precision agriculture approach based on these maps, farmers in Kura LGA can optimize their fertilizer inputs, improve crop yield, and ensure the long-term sustainability of their soil resources.
CONCLUSION
The application of geostatistical techniques to the soil data from Kura Local Government Area, Kano State, has provided a critical, spatially explicit understanding of the available micronutrient status. The study confirmed that the soil fertility of the area is characterized by high to moderate spatial variability for all four micronutrients (Zn, Cu, Mn, and Fe), with coefficients of variation ranging from 28.6% to 68.9%. This heterogeneity demonstrates the inadequacy of traditional, blanket fertilizer recommendations for the region. While the mean concentrations of available Zn (13.2 mg/kg), Cu (2.01 mg/kg), Mn (26.1 mg/kg), and Fe (170 mg/kg) suggest a general state of sufficiency or even excess compared to common critical levels, the spatial distribution maps revealed significant localized differences. Specifically, the maps successfully delineated: Areas of potential Zinc deficiency in the western part of the LGA; A highly patchy distribution of Manganese, indicating zones that may be prone to either deficiency or toxicity; Widespread high Iron concentrations, which, while generally beneficial, require careful management to avoid antagonism with other nutrients. The Kriged maps generated in this study serve as a powerful decision-support tool for implementing Precision Agriculture in Kura LGA. The primary recommendation is for farmers and agricultural extension services to utilize these maps to delineate site-specific management zones. This approach will enable the targeted application of micronutrient fertilizers only where deficiencies are confirmed, leading to: Increased fertilizer use efficiency and reduced input costs; Mitigation of environmental risks associated with nutrient over-application; Optimization of crop yield and nutritional quality by correcting localized imbalances. Future research should focus on validating these management zones through field trials, correlating the mapped micronutrient status with actual crop yield data, and investigating the relationship between the high Fe and Mn concentrations and the availability of other essential nutrients.
REFERENCES
Abdulkadir A., Dawaki M.U., Sani M. (2019). Effect of organic soil amendments on soil chemical properties in Sudan Savannah of Nigeria. Nigerian Journal of Soil Science, 30: 122-132.
Abdulkadir A., Halilu Y., Sani S. (2022). Evaluation of physical and chemical properties of soils at Bichi local government area, Kano State, Nigeria. IRE Journal, 5: 556–562.
Abdulkadir A., Manne I.Z., Sani S. (2025a). Impact of distance from the water body on the point of zero charge of Dutsin-Ma Dam floodplain soils, Katsina State, Nigeria. International Journal of Bonorowo Wetlands, 15(1).
Abdulkadir A., Musa S., James D. (2025b). A review of the role of cover crops in mitigating soil health degradation and other challenges associated with maize monoculture. FUDMA Journal of Agriculture and Agricultural Technology, 11: 115-128.
Abubakar M., Umar S., Ibrahim M. (2022). Evaluation of soil physical properties under different land-use systems in northern Nigeria. African Journal of Soil Science, 10: 57–65.
Adamu I.M., Sharu M.B., Ahmed A.Y. (2021). Assessment of spatial variability of soil fertility parameters for precision agriculture in Kano State, Nigeria. Nigerian Journal of Soil Science, 31: 89–102.
Adesoji A.G., Aliyu A., Musa M., Musa S., James D. (2025). Assessment of soil health status and exploring the potential of its improvement using cover crops in Dutsin-Ma, Katsina State. Sahel Journal of Life Sciences FUDMA, 3: 192–197.
Adhikari K., Hartemink A.E. (2016). Linking soils to ecosystem services — A global review. Geoderma, 262: 101–111.
Adugna A., Abegaz A. (2020). Effects of land use changes on the dynamics of selected soil properties in northeast Ethiopia. Soil and Tillage Research, 200: 104611.
Alemayehu D., Fite T., Ayenew B. (2023). Assessment of soil fertility status and cation exchange capacity in smallholder farms of Ethiopia. Heliyon, 9: e13245.
Arunkumar V., Paramasivan M. (2015). Spatial variability and geostatistics application for mapping of soil properties and nutrients in intensively cultivated village of Veeranam Command Area, Tamil Nadu. Asian Journal of Soil Science, 10: 299–305.
Ayoola O.T., Adebayo A.G., Adeyemi O.S. (2021). Organic carbon and nutrient dynamics of soils under different cropping systems in southwestern Nigeria. International Journal of Agronomy, 2021: 1–8.
Bhunia G.S., Shit P.K., Maiti R. (2018). Comparison of IDW and Kriging interpolation methods for spatial distribution of soil properties in Nadia District, West Bengal, India. Modeling Earth Systems and Environment, 4: 1045–1052.
Cambardella C.A., Moorman T.B., Novak J.M., Parkin T.B., Karlen D.L., Turco R.F., Konopka A.E. (1994). Field-scale variability of soil properties in central Iowa soils. Soil Science Society of America Journal, 58: 1501–1511.
Dawaki M.U., Abdulkadir A., Abdulrahman B.L. (2020). Comparative potential effects of biochar, compost and inorganic fertilizer on major nutrient ions mobility and stability in screen-house irrigated maize in the drier savannas of Nigeria. Nigerian Journal of Soil Science, 29: 122–132.
FAO (2006). Guidelines for soil description (4th ed.). Rome: Food and Agriculture Organization of the United Nations.
FAO (2021). Guidelines for soil description (5th ed.). Rome: Food and Agriculture Organization of the United Nations.
FMARD (2020). National soil fertility mapping and fertilizer recommendation handbook for Nigeria. Abuja: Federal Ministry of Agriculture and Rural Development.
Gee G.W., Bauder J.W. (1986). Particle-size analysis. In A. Klute (Ed.), Methods of soil analysis: Part 1—Physical and mineralogical methods (2nd ed., pp. 383–411). Madison, WI: ASA and SSSA.
Hendershot W.H., Lalande H., Duquette M. (2008). Soil reaction and exchangeable acidity. In M. R. Carter and E. G. Gregorich (Eds.), Soil sampling and methods of analysis (2nd ed., pp. 173–178). CRC Press.
IITA (2015). Soil and plant analytical methods: Laboratory manual. Ibadan, Nigeria: International Institute of Tropical Agriculture.
ISRIC (2020). World Soil Information Service (WoSIS): Procedures manual. Wageningen: International Soil Reference and Information Centre.
Lindsay W. L., Norvell W.A. (1978). Development of a DTPA soil test for zinc, iron, manganese, and copper. Soil Science Society of America Journal, 42: 421–428.
Murtaza G., Ashraf M., Rehman A. (2022). Geospatial variability assessment of soil nutrients and implications for sustainable nutrient management. Geoderma Regional, 30: e00542.
Nelson D.W., Sommers L.E. (1996). Total carbon, organic carbon, and organic matter. In D. L. Sparks (Ed.), Methods of soil analysis: Part 3: Chemical methods (pp. 961–1010). Madison, WI: Soil Science Society of America.
Nweke I.A., Igwe C.A., Onyekwere I.N. (2022). Spatial variability of selected soil fertility parameters in humid tropical soils of southeastern Nigeria. Geoderma Regional, 29: e00512.
Oliver M.A., Webster R. (2015). Basic steps in geostatistics: The variogram and kriging. Springer International Publishing.
Olsen S.R., Cole C.V., Watanabe F.S., Dean L.A. (1954). Estimation of available phosphorus in soils by extraction with sodium bicarbonate. USDA Circular No. 939.
Rhoades J.D. (1982). Cation exchange capacity. In A. L. Page (Ed.), Methods of soil analysis, Part 2: Chemical and microbiological properties (2nd ed., pp. 149–157). Madison, WI: ASA and SSSA.
Rhoades J.D. (1996). Salinity: Electrical conductivity and total dissolved solids. In D. L. Sparks (Ed.), Methods of soil analysis: Part 3: Chemical methods (pp. 417–435). Madison, WI: SSSA.
Sani S., Abdulkadir A., Hmad Pantami S.A., Sani M., Amin A. M., Abdullahi M.Y. (2023). Spatial variability and mapping of selected soil physical properties under continuous cultivation. Turkish Journal of Agriculture. Food Science and Technology, 11: 719–729.
Sani S., Sani M., Salihu A.P., Aliyu A., Yakubu M., Garba N.H., Basiru L.J. (2022). Spatial variability of soil hydraulic properties in Jibia Irrigation Project, Katsina State, Nigeria. Natural Resources and Sustainable Development, 12: 245–254.
Sharu M.B., Adamu I.M., Auwal M.A. (2020). Evaluation of soil fertility variability using geostatistical techniques in Sudan Savanna of Nigeria. Nigerian Journal of Soil and Environmental Research, 18: 32–41.
Soil Survey Staff (2017). Soil survey manual (2nd ed.). Washington, D.C.: USDA Handbook No. 18.
Wilding L.P. (1985). Spatial variability: Its documentation, accommodation, and implication to soil surveys. In D. R. Nielsen and J. Bouma (Eds.), Soil spatial variability (pp. 166–194). Wageningen: Pudoc.