Mapping the risk of soil erosion using RUSLE, GIS and remote sensing: a case study of Zou watershed in central Benin
Abstract
Being aware that soil erosion is one of the major environmental problems of the 21st century, this research integrates the Revised Universal Soil Loss Equation (RUSLE) with a Geographic Information System (GIS) to assess erosion risk on Zou watershed in the centre Benin. RUSLE factor values (rain erosivity, soil erodibility, slope length and steepness, cover and support practices) for the study area were determined and spatialized. The rain erosivity (R-factor) was estimated based on the daily rainfall data from five rain gauges installed in the watershed. The slope length and steepness (LS-factor) were extracted from the Digital Elevation Model of the watershed. The soil erodibility (K-factor) calculation was based on the percentage of fine sand, silt, clay and organic matter in the soil as well as the water infiltration rate. 120 representative sampling points were taken into account in the different soil-mapping units of the watershed. The land cover factor (C factor) estimation was based on the Normalized Difference Vegetation Index (NDVI). The NDVI was calculated from a 30 m resolution Landsat-8 image. The adopted support practices on the watershed were investigated. The values of the P factor were attributed to each practice based on literature review. Data sets for the RUSLE factors, along with associated maps showing geographic distributions, were established on ArcGIS. ArcGIS was used to interactively calculate soil loss and map the erosion risk. The mean R-factor value was 915 MJ.mm.ha-1.year-1. The spatial distribution of the C-factor showed that 81.0% of the surface has low protection, 8.6% has medium protection and 11.0% had from good to very good protection against water erosion. The LS-factor value ranged from 0 to 39 in the watershed. The mean soil erodibility is 0.15 t.h.MJ-1.mm-1 over the watershed. The average erosion, for the watershed is 16.2 t.ha-1.year-1 which corresponds to a very high vulnerability level. The watershed area affected by low, moderate, high and very high erosion risk are respectively 3.1%, 22.4%, 22.9% and 51.6%. However, most of the eroded soil is from the area with low vegetation cover, high soil erodibility and with moderate and Gentle undulating. The findings of this study could constitute a baseline for any future development of the watershed.
Keywords: Soil Erosion, USLE, GIS, Zoo Watershed, Benin
INTRODUCTION
Soil degradation, a global problem threatens agricultural production and food security all over the world (Bargali et al., 1993, 2019, Padalia et al., 2018) and more specifically in Sub-Saharan Africa (Hiepe, 2008). In Benin, strong anthropization of natural ecosystems, land overexploitation and inadequate agricultural practices have strongly contributed to a profound spatial and temporal dynamics of the agricultural sector (Igué et al., 2008). These changes increased pressure on land, which has led to an increased degradation (Kintché et al., 2015), especially water erosion. In the centre of Benin, the situation is more worrying. In this part of Benin, the first rains are often in the form of localized and violent storms. They fall on soil and stream instantly, causing even stripping of the soil surface. The watershed of Zou is a part of the Centre-Benin area and perfectly illustrates the problem of soil degradation.
For several decades, sustainable land management has been the subject of research and development programs/projects in Benin. Although chemical soil degradation has been well studied in Benin, physical soil degradation and water erosion were less studied. However, effective control of soil erosion constitutes a critical component of natural resource management and sustainable agriculture (Lu et al., 2003). Soil erosion modelling emerged with the Universal Soil Loss Equation (Panagos et al., 2015). Recent inventory (Karydas et al., 2014) had identified up to 80 water-erosion models classified as empirical, conceptual, physically-based or process-oriented. The Universal Soil Loss Equation (Wischmeier and Smith, 1978) and RUSLE are the most commonly used (Renard et al., 1997) due to their high degree of flexibility and data accessibility, a parsimonious parametrization, extensive scientific literature and comparability of results allowing to adapt the model to nearly every kind of condition and region of the world (Lu et al., 2003, 2004; Panagos et al., 2015; Alewell et al., 2015).The USLE estimated sheet and rill erosion using i) rain erosivity (R-factor), ii) soil erodibility (K-factor), iii) Land Use/Cover (C-factor), iv) topographic factor including the length of the slope and the steepness of the slope (LS-factor) and v) support practices factor (p-factor). The equation has several deficiencies, due to its empirical character and lack of integration of deposition and wind and gully erosion (Hiepe, 2008). As with all empirical methods, the model concept is not based on process description and simulation but rather on understanding a process, capturing the confounding measurable parameters and delineating a mathematical algorithm out of the relationship between these parameters and the measured output (Alewell et al., 2019). Several research works had modified the USLE’s factors for local and regional conditions (Roose, 1977; McCool et al., 1987; Arnoldus, 1980; Renard and Fremund, 1994; Desmet and Govers, 1996; Millward and Mersey, 1999; Panagos et al., 2015). Since the 1990’s, Geographical Information System (GIS) and remote sensing are integrated in soil erosion modelling. GIS application in soil erosion analysis is increasing because of the advantages of combining GIS and soil erosion models (Soo Huey, 2011). The use of remote sensing and geographical information system (GIS) techniques makes soil erosion estimation and its spatial distribution feasible with reasonable costs and better accuracy in larger areas (Millward and Mersey,1999; Wang et al., 2002). The integration of USLE/RUSLE and GIS can also be used as an automation tool to assist in the standardization of the application of the USLE/RUSLE to large areas (Soo Huey, 2011).
This study aims at using a RUSLE model with remote sensing and GIS to assess the soil erosion risk and to identify the areas susceptible to soil erosion requiring soil conservation action at watershed scale.
METHODOLOGY
Study area
The studied watershed is a part of the watershed of Zou located between Atchérigbé (Dassa) and Domè (Zogbodomey) in the Centre of Benin and extends from 7°05’0’’N, 2°04’E to 7°42’0’’N, 2°24’E (Figure 1). It is bounded to the East by the watershed of Ouémé and at West by the watersheds of Hlan, Couffo and Mono. The watershed covers 1473 km² and extends on some parts of the municipalities of Djidja, Za-Kpota, Covè, Zangnanado and Dassa-Zounmè. Mean annual rainfall of the watershed varies from 1100 to 1300 mm, with a bimodal pattern of rainfall distribution. Long time monthly temperature minima range from 22 to 24°C and temperature maxima range from 25 to 37°C with the average temperature from 23 to 30°C. The geological materials of the watershed are formed of very old layers of the Dahomeyen stage of the old basement, sedimentary series of the Eocene, post-Eocene and Upper Cretaceous; eruptive rocks and recent deposits (Faure and Volkoff, 1998).
Estimation of RUSLE factors on the watershed
Several methods integrating erosion factors have been developed. Current models for quantifying sheet and rill erosion are generally based on the USLE and its revised version RUSLE (Renard et al., 1997).
Where A = Annual soil loss (t.ha-1.year-1); R = Rainfall-runoff erosivity index (MJ.mm.ha-1.h-1. year-1); K = Soil-erodibility factor (t.h.MJ-1.mm-1); LS = slope Steepness and slope Length factor; C = Cover-management factor; P = Conservation practice factor.
Rainfall - runoff erosivity index (R factor)
The rainfall erosivity index, R factor, in the USLE and RUSLE models, is an index of rainfall erosivity which is the potential ability of the rain to cause erosion. The higher is rainstorm intensity, the greater is the erosion potential. The R factor initially presented by Wischmeier and Smith (1978) must be calculated for each rainfall event based on the kinetic energy (E) and the maximum intensity over 30 minutes of a rainstorm event (I30):
R=E*I30
However, this equation needs high-resolution data which are not available in Benin. The only reliable data source is the meteorological data collection network of the “Agence Internationale pour la Sécurité et la Navigation Aérienne en Afrique et au Madagascar (ASECNA)” which provides rainfall data. Several simplified equations including daily, monthly or annual rainfall have been developed and tested (Roose, 1977; Arnoldus, 1980; Renard and Fremund, 1994). But the most applicable equation is the one developed by Roose (1977) for West Africa including Benin:
Where R in 100 feet-ton.pouce.acre.-1.h-1.year-1 = Erosivity index and H = mean annual rainfall. To convert R form 100 feet-ton.pouce.acre.-1.h-1.year-1 to MJ.mm.ha-1. h-1. year-1, the coefficient 1.69 (Wall et al., 2002) was applied.
In the present study, the R-factor of the Zou watershed was computed from available rain gauge data because the watershed had no record of daily rainfall intensity. These are the stations of Dassa-zounmè, Savalou, Zangnanado and Bohicon. Rainfall data were taken from 1997 to 2017 (20 years) with the Agence Internationale pour le Sécurité et la Navigation Aérienne en Afrique et au Madagascar (ASECNA) representation in Benin. The spatial interpolation was achieved using the Inverse Distance Weight technique in the ArcGIS software along with rainfall data of faraway rain gauge stations for assessing the spatial variability in the rainfall and rainfall erosivity in the study area.
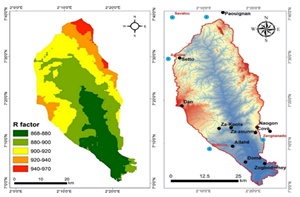
The R factor calculated showed a gradient of values ranging between 883 to 988 with a mean of 915 MJ.mm.ha-1.year-1 (Table 1). The spatialization map of the R factor (Figure 2) shows an increasing staging of its values from upstream to downstream. Thus, the erosivity of the rain naturally increases from the most watered areas to the less watered areas. For instance, in 62 % of the watershed area, the value R-factor was less than or equal to the mean. The lowest R values coincided with the lower elevations of the watershed. They are established between the municipalities of Zogbodomey and Zangnanado.
Land use and land covers (LULC) and Cover-management factor (C factor)
Vegetation cover can influence the risk of water erosion, due to its impact on runoff. The vegetation cover is considered effective against erosion when it absorbs the kinetic energy of raindrops and protects the soil especially when the precipitation is intense. Its value varies from 0 to 1. It tends to 0 when the vegetation cover is dense and tends to 1 when the vegetation cover is weak. From the origin the C-factor is considered as the ratio of soil loss from land cropped under specific conditions to the corresponding loss from clean-tilled, continuous fallow (Wischmeier and Smith, 1978). Currently due need of spatialization at large scale, satellite remote sensing data sets were used for the assessment of C-factor (Prasannakumar et al., 2012). Several indicators of the vegetation vigor and health have been used. However, the most used is the Normalized Difference Vegetation Index (NDVI). The formula used for determining Cis as follows (Zhou et al., 2008; Kouli et al., 2009):
Where α and β are parameters without units that determine the shape of the curve connecting NDVI to C.
Landsat-8/LDCM from January 2018 were used to determine the NDVI. This equation has been proven to be more accurate than a linear relation (Van der Knijff et al., 2000). These authors attributed values 2 and 1 to α and β respectively. The land use was mapped using a Landsat-8/LDCM from January 2018 as described in Lu et al. (2004). Field data collection was conducted in March 2018. Different LULC types were identified and their coordinates were recorded with a GPS device. These data were used as training samples for supervised classification of Landsat-8/LDCM data. About 10 to 15 sample plots for each class were selected. Maximum likelihood classifier (MLC) was used to classify the Landsat-8/LDCM data into ten LULC classes: Dense Forest; Gallery Forest; Open canopy forest and timbered savannah; Pasture; Swamp forest; Plantation; Cultivated and Fallow land; Built-up-land; Hill and Swamp.
The C-factor value ranged from 0.3 to 0.9. More than 80% of the watershed area had very low protection (C>0.5) (Figure 3). Highly vegetated areas (tropical rain forests and gallery forests) were associated with low C values (0.3) and the highest coefficient (0.9) was associated with the bare soils. A total of 10 main land use units were mapped on the watershed (Table 2). The areas under dense vegetation (tropical rain forests and gallery forests) occupied less than 3 % of the watershed. Anthropized land use was the most represented. Cultivated and fallows area were enclosed by 50% of the studied area. Fields and fallows were characterized by very sparse vegetation which is cleared for cultivation. Plantations were scarce and was made of exotic forest species. This is the forest of Zouto-Atchérigbé which is estimated to cover 5% of the watershed.
Soil erodibility (K factor)
The erodibility factor expresses the soil vulnerability to water erosion. It depends on the physical and chemical properties of the soil. The soil units mapping and the soil polygon coverage of the watershed was based on the standard soil series map of the area (Volkoff, 1976). One hundred and twenty (120) representative sampling points were taken account on the different soil-mapping units on the watershed. The sampling points were chosen in such a way that the soil samples represent the different soil unit as well as land use types of the watershed. For each sampling point, one grid of 3 m x 3 m was installed and the samples were taken at each side of the grid from the top to 30 cm in depth. The composite sample was done for each sampling point by mixing the sample collected for each grid. In laboratory, the samples were air dried, sieved through 2 mm mesh. The particle size analysis was done using the Robinson pipette method. The considered fractions are clay (0-2 μm); silt (2-50 μm); very fine sand (50-100 μm); fine sand (100-200 μm) and coarse sand (200-2000 μm). The soil organic matter content was determined using the method of Walkley and Black. The soil permeability was measured by the method of “double ring”.
The regression equation developed by Wischmeier and Smith (1978) to estimate the value of the soil erodibility (K) was used for this study.
Where M is the particle size factor; M = (% silt + % very fine sand) (100 -% clay); OM= organic matter content (%); s = structure class; p = permeability class. The structure and permeability class established by FAO (2006) were used.
Analyses were performed in the Laboratory of Soil Microbiology and Microbial Ecology of the Faculty of Agronomic Sciences of the University of Abomey-Calavi (Republic of Benin).
The mean soil erodibility was 0.15 t.h. MJ-1.mm-1 over the watershed. But it varied depending on the type of soil (Table 3). In fact, the Eutric Gleysol was the most erodible (K = 0.29 t.h. MJ-1.mm-1) and the vertisol was the least erodible (k = 0.095 t.h. MJ-1.mm-1) on the watershed.
Slope factor (LS Factor)
The slope-length (L) and slope-steepness (S) factors are commonly combined as LS and referred to as the Slope factor. USLE represents the combined effects of rill and sheet erosion. Rill erosion is mainly caused by surface runoff and increases following the slope. Sheet erosion is caused primarily thought the splash effect. Therefore, the L factor is greater for those conditions where rill erosion tends to be greater than sheet erosion. The LS factor was calculated using LS-TOOL developed by Zhang et al. (2013). The L was calculated based on the Calculating L is based on the equation developed by Desmet and Govers (1996).
Where is the contributing area at the inlet of grid cell (i,j) measured in m². D is the grid celle size (meters), = sin+ cos, the is the aspect direction of the grid cell (i,j).
m is related to the ratio β of the rill to interill erosion:
θ is the slope angle in degrees. The m ranges between 0 and 1, and approaches 0 when the ratio of rill to interill erosion is close to 0 (McCool et al., 1989).
As of S, its calculation is based on the equation developed by McCool et al. (1987), which was adopted in the RUSLE model by Renard et al. (1997) for better representation of the degree of slope inclination
S = 10.8 sin θ + 0.03 if θ <0.09
S = 16.8 sin θ - 0.50 if θ ≥0.09
where θ is the gradient of slope in degrees.
The methodology for calculating the LS factor is applied to each pixel of 30 m - resolution Digital Elevation Model (DEM). A digital elevation model of 30 m of resolution, downloaded from the ASTER GDEM site (https://aster web.jpl.nasa.gov/gdem.asp), was used to calculate LS factor.
LS pattern in the studied area is shown on the Figure 4. The relative flat topography of the watershed implies a fairly low distribution of LS values between 0 and 39.2. Only 1 % of the values are estimated to be moderate and the average of the factor over the entire watershed is estimated at 6.62.
Conservation practice factor (P factor)
The factor P expresses the influence of soil conservation practices on erosion. The values of P are less than or equal to 1. The value 1 is attributed to land on which no conservation practice is used. In the present study, the P-factor map was derived from the soil erosion control practices. The soil erosion control practices adopted on the watershed were adopted from Akplo et al. (2019). The mains support practices identified were Ridging parallel to the slope; mulching; isohypse ridging and no -tillage. The values of the P factor were attributed to each support practice based on the finding of Kouelo (2016) and Akplo et al. (2017).
The P factor map was prepared from the LULC data and support practices adopted on the studied watershed. Its values ranged from 0 to 1. Farmers used isohypse ridging, mulching, agroforestry systems, tree plantations and fallow as support practices. The lower P values were found around the water bodies and the covered areas, and the higher P values were observed in mountain areas, built-up areas and agricultural land where any support practices are not adopted.
Assessment and mapping of erosion risk
The RUSLE was applied in GIS based as shown in Figure 4. The combination of all data and the application of the model were carried out with the ArcGis 10.5 software (map, spatial analysis, data combination, edition of thematic maps and the implementation of the GIS). The working resolution is 30 m, and the projection system applied to all our data is Transverse_Mercator. The calculated map was classified as follow: Low (0-1.5 t.ha-1.year-1); Moderate (1.5-5 t.ha-1.year-1); High (5-10 t.ha-1.year-1) and Very High (> 10 t.ha-1.year-1). The validity of the results was testified by two ways. First, the significance of each of the factor used in the model was determined using a linear regression approach. One hundred and thirty-nine (139) points were randomly selected and the values of R factor, C factor, K factor, LS factor and P factor were calculated. Secondly, on the final erosion map of RUSLE, the GPS coordinates of ten (10) points were chosen and the field conditions and the water erosion evidence were examined (FAO, 1979).
RESULTS
Average annual soil erosion and evaluation of erosion intensity
The average annual soil erosion potential (A) was estimated by multiplying the developed raster data from each USLE factor (A= R*K*L*S*C*P). The mean annual soil erosion for the watershed is 16.24 t.ha-1.year-1 with a standard deviation of 40.12 t.ha-1. The maximum soil erosion was 1621.64 t.ha-1.year-1 and obtained on the mountain areas whilst, the minimum soil erosion is 0.0 t.ha-1.year-1. Four erosion risk classes were obtained (Figure 5). More than 50% land area (76063 ha) was observed to be under very high erosion risk, where soil erosion modulus was less than 10 t.ha-1.year-1; the amount of annual soil loss was 21.57 x 10⁶ t, accounting for 84.3% of the total soil loss in the study area. Around 23% of the watershed area was under high erosion risk and the amount of soil potentially eroded from this area is 2.70 x 10⁶ t accounting for 10.56% of the total soil losses in the study area. Low and moderate erosion risk concerned 25.44% (37484.01 ha) of the watershed area and contribute to around 5% (1.31 x 10⁶ t) to the total soil eroded on the watershed (Table 4).
Soil erosion assessment on the different soil types
Humic gleysol, Haplic acrisol, Rhodic ferralsol and Ferric luvisol were the most eroded and contribute to more than 50% of the soil erosion on the watershed (Table 5). However, the highest mean soil erosion was obtained on the Ferric luvisol (31.4 t.ha-1.year-1). Vertisols have the lowest soil erosion mean and contribute to 0.13% of the total annual soil loss amount.
Soil erosion assessment on different LULC types
Table 6 shows the variation of soil erosion by LULC. Areas with high mean erosion correspond to areas of low cover. Cultivated and Fallow land, Pasture as well as Hill land have the most important soil erosion, contributing to more than 90% of the annual soil loss amount. Thus, Cultivated and Fallow land have the uppermost soil loss amount with large proportion of land area among all LULC types. Each year 19.39 x 10⁶ t are potentially eroded from the Cultivated and Fallow land on the watershed. Dense Forest and Gallery Forest areas are less eroded and the amount of soil lost yearly is close or equal to 0 on the watershed.
Soil erosion assessment on landform types
Landforms of the study area were classified into 5 main types by the slope steepness (Table 7). On the watershed of Zou, more than 75% of the annual soil loss amount were eroded from Gently undulating and Moderately undulating areas. The flat areas concerned around 15% (23489.09 ha) of the watershed area and contributed to less than 13% of total soil amount lost.
Accuracy of the model and Validity of the results obtained
The model established was statically significant and have a good adjustment (R²=0.76) (Table 8). All of the factor used for the model calculation were significant of water erosion estimation (Table 9). However, the R factor was the most important factor and the K factor is the less important for water erosion on the watershed of Zou. The results showed that erosion can be express by the following equation on the watershed of Zou:
The field verification revealed that the localizations with high erosion value are associated to poor conditions (Table 10). Also, the presence of gullies was the most observed indicator at the most eroded localizations.
DISCUSSION
As with all empirical methods, the USLE model concept is not based on process description and simulation but rather on understanding a process, capturing the confounding measurable parameters and delineating a mathematical algorithm out of the relationship between these parameters and the measured output (Alewell et al., 2019). USLE does not includes the deposition and can only simulate sheet and rill erosion (Fistikoglu and Harmancioglu, 2002). In addition, the model fails to predict event erosion, which is highly influenced by the fact that the USLE and its revisions (RUSLE) do not consider runoff explicitly.
Despite all these limitations, the USLE and its revised version (RUSLE) are a very useful tool when integrated with GIS, especially for conditions in developing countries where lack of data excludes reliable applications of more advanced, physically-based models (Beskow et al., 2009; Kinnell, 2010). In Benin, the available data do not allow the effective application of these physically based models. Integrating the USLE in GIS to access and spatialize water erosion on the watershed of Zou, this research work led to a good result. Erosion factors were determined using already tested methods and validated for West Africa or Benin. The results show that erosion factors determined significantly influence water erosion. This finding meets the initial hypothesis of the USLE/RUSLE model and reveals the validity of the soil erosion calculated.
The average erosion obtained for this study is 16.24 t.ha-1 with a standard deviation of 40.1 t.ha-1; this reflects the significance variability of water erosion in the watershed. This value is closed of Kouelo (2016) with find a mean erosion of 17.7 t.ha.year-1, using cesium-137 as print finger to estimate soil erosion in south of Benin. This value is lower than the one obtained by Tamene and Le (2015) which concludes that soil loss is closed to 25-75 t. ha–1.year–1 in sub-Saharan Africa. It is also lower than the finding of Kagabo et al. (2013) and Kabirigi et al. (2017) who observed soil loss of 32 and 41.5 t. ha-1.year-1. The achieved soil erosion is higher than the average in West Africa which is 10 t. ha-1.year-1 according to LAL (1995). On the watershed, respectively 3.08%, 22.4%; 22.9% and 51.6% of the watershed area are affected by low (0-1.5 t. ha-1.year-1); moderate (1.5-5 t. ha-1.year-1); high (5–10 t. ha-1.year-1) and very high erosion risk (> 10 t.ha-1.year-1).
The results of this study showed that the Humic gleysol, Haplic acrisol, Rhodic ferralsol and Ferric luvisol are the most eroded soils. This high erosion observed on the Humic gleysol, Haplic acrisol can be due to its very slow drainage (< 1mm. h-1), linked to their very fine texture. Soil erosion is a selective process. It preferentially concerns the fine particles of soil. Likewise, runoff often occurs when the rain water can’t infiltrate (Le Bissonnais et al., 2005). As for the Rhodic ferralsol, the high mean erosion obtained can be due to the low organic matter content (1.29%) as the soil organic matter constitutes a key factor for soil stability. Similar results have been obtained by Sadiki et al. (2004). Indeed, this author had found that soil erodibility is strongly correlated with soil erosion (R² = 0.87) in Morocco. Landscape, vegetation cover and forest floor biomass are the major factor responsible for the soil erosion, nutrient loss and enhance the processes of land degradation (Bargali 1994, 1995,1996; Bargali et al., 2018). Our results showed that soil erosion increases according to the level of anthropization of the land use. Indeed, an erosion of 31.4 t. ha-1.year-1 was obtained in fields and fallow lands, while in gallery forests and dense forests, average erosion is less than 1 t.ha-1.year-1. The influence of land covers on erosion risk has been evaluated by Prasannakumar et al. (2012), and found that severe and high levels of soil erosion were distributed on the grassland, degraded plantation, and deciduous forest areas.
On the watershed, the topography constitutes an important factor for soil erosion process. Findings showed that soil loss is increasing with the slope steepness. The most important erosion level was obtained on mountainous area (31.7 t.ha-1.year-1) while the areas under Gently undulating and Moderately undulating contribute for 68% to the total soil loss. While processes such as nutrient depletion, loss of soil organic matter, and soil acidification are generally reversible, soil erosion is usually an irreversible process (Greenland, 1994). Soil erosion threatens agricultural productivity, food security and environmental sustainability (Kurothe et al., 2014). In addition, the rate of erosion may not be necessarily greater in the tropics than in temperate regions, but the resulting productivity decline is often more drastic due to the harsh climate, low soil fertility, the poor quality of the subsoil (LAL, 1990), or unstable soil properties (Steiner, 1994). Traditional resource-poor farming systems become unsustainable as natural fallow periods have to be shortened due to population growth. This study can thus help to raise the awareness of all the actors of the rural world in Benin. In fact, erosion control practices and sustainable land management strategies adapted to each level of risk identified through this study must be tested and promoted in these areas.
CONCLUSION
On the watershed of Zou, the removal of fine particles by the runoff causes an increase in concretion and a decrease in the depth of the top soil layer. Findings showed that this watershed presents favorable factors for water erosion. The average soil erosion is 16.24 t. ha-1.year-1 but with a great variability. Only 3.08% of the watershed area are associated with low potential soil erosion. On other hand, more than 90% of the watershed area are concerned by moderate, high and very high potential erosion risk. This means that there is urgently need of soil conservation strategies. The methodology used to spatialize water erosion risk at watershed scale showed acceptable precision and allowed for identification susceptible areas to soil erosion requiring soil conservation strategies. This model is an important predictive tool for developing countries where the available data do not always allow the application of most efficient models. In spite of these satisfactory results obtained for this study using the available data, it is important to point the very small number of rain stations used. In addition, the gully erosion was not taken account. However, the finding of this study could constitute a reference document for any proposed development. Policy makers and soil conservationists can base on the findings to implement rational and sustainable soil conservation strategies in mitigating the effects of water erosion on cultivated fields and at the same time protecting the water quality of the Zou river.
REFERENCES
Akplo T.M., Kouelo Alladassi F., Houngnandan P., Ahoglé Agassin M.A., Alohoutadé F.M., Benmansour M., Mabit L., Rabesiranana N. (2017). Effect of tillage and mulching on soil water erosion in Linsinlin watershed, Centre of Benin. Journal of Experimental Biology and Agricultural Sciences, 5: 515-524.
Akplo T.M., Kouelo Alladassi F., Houngnandan P., Azontondé H.A., Agonvinon M.S., Bokossa T.S. (2019). Factors Influencing Soil Erosion Control Practices Adoption in Centre of the Republic of Benin: Use of Multinomial Logistic. Journal of Agricultural Science, 11: 110-122.
Alewell C., Egli M.., Meusburger K. (2015). An attempt to estimate tolerable soil erosion rates by matching soil formation with denudation in Alpine grasslands. Journal of Soils and Sediments, 15: 1383-1399.
Alewell C., Borrelli P., Meusburger K., Panagos P. (2019). Using the USLE: Chances, challenges and limitations of soil erosion modelling. International Soil and Water Conservation Research, 7: 203-225.
Arnoldus H.M. (1980). An approximation of the rainfall factor in the Universal Soil Loss Equation. In: Assessment of erosion. Eds. M. de Boodt, D. Gabriel. Chichester, West Sussex, UK. John Wiley and Sons, Inc. pp. 127–132.
Bargali K., Vijyeta M., Padalia K., Bargali S.S., Upadhyay V.P. (2018). Effect of vegetation type and season on microbial biomass carbon in Central Himalayan forest soils, India. Catena, 171: 125-135.
Bargali S.S., Singh R.P., Mukesh J. (1993). Changes in soil characteristics in eucalypt plantations replacing natural broad-leaved forests. Journal of Vegetation Science, 4: 25-28.
Bargali S.S. (1994). Forest floor development in Eucalyptus tereticornis Sm. plantations in a part of Central Himalayan tarai belt. Range Management and Agroforestry, 15: 61-68.
Bargali S.S. (1995). Efficiency of nutrient utilization in an age series of Eucalyptus tereticornis plantations in the tarai belt of Central Himalaya. Journal of Tropical Forest Science, 7: 383-390.
Bargali S.S. (1996). Weight loss and nitrogen release in decomposing wood litter in an age series of eucalypt plantation. Soil Biology and Biochemistry, 28: 699-702.
Bargali S.S., Padalia K., Bargali K. (2019). Effects of tree fostering on soil health and microbial biomass under different land use systems in central Himalaya. Land Degradation & Development, 30: 1984-1998.
Beskow S., Mello C.R., Norton L.D., Curi N., Viola M.R., Avanzi J.C. (2009). Soil erosion prediction in the Grande River Basin, Brazil using distributed modeling. Catena, 79: 49-59.
Desmet P.J.J., Govers G. (1996). A GIS procedure for automatically calculating the USLE LS factor on topographically complex landscape units. Journal of Soil and Water Conservation, 51:427–433.
FAO (1979). A Provisional Methodology for Soil Degradation Assessment. Rome, 84 p.
FAO (2006). Guidelines soil profile description. Fourth edition. (Food and Agricultural Organization), Rome 109p.
Faure P., Volkoff B. (1998). Some factors affecting regional differentiation of the soils in the Republic of Benin (West Africa). Catena, 32: 281-306.
Fistikoglu O., Harmancioglu N.B. (2002). Integration of GIS with USLE in assessment of soil erosion. Water Resources Management, 16: 447-467.
Greenland D.J. (1994). Soil Science and Sustainable Land Management. In: Soil science and sustainable land management in the tropics. J. K. SYERS and D. L. RIMMER. Wallingford, CABI: 1-15
Hiepe C. (2008). Soil degradation by water erosion in a sub-humid West-African catchment: a modelling approach considering land use and climate change in Benin. Thesis Dissertation. Rheinischen Friedrich-Wilhelms-Universität Bonn. 335p.
Igué A.M., Agossou V., Ogouvidé F.T. (2008). Influence des systèmes d’exploitation agricole sur l’intensité de la dégradation des terres dans le Département des Collines au Bénin. Bulletin de la Recherche Agronomique du Bénin, 61: 39-51.
IUSS Working Group WRB (2015). World Reference Base for Soil Resources 2014, Update 2015. International Soil Classification System for Naming Soils and Creating Legends for Soil Maps. World Soil Resources Reports No. 106, Rome: FAO.
Kabirigi M., Mugambi S., Musana S.B., Ngoga T.G., Muhutu J.C., Rutebuka J., Ruganzu V., Nzeyimana I., Nabahungu N.L. (2017). Estimation of soil erosion risk, its valuation and economic implications for agricultural production in western part of Rwanda. Journal of Experimental Biology and Agricultural Sciences, 5: 525-536.
Kagabo D., Stroosnijder L., Visser S.M., Moore D. (2013). Soil erosion, soil fertility and crop yield on slow-forming terraces in the highlands of Buberuka, Rwanda. Soil and tillage research, 128: 23-29.
Karydas C.G., Panagos P., GitasI Z. (2014). A classification of water erosion models according to their geospatial characteristics. International Journal of Digital Earth, 7: 229–250.
Kinnell P.I.A. (2010). Event soil loss, runoff and the Universal Soil Loss Equation family of models: a review. Journal of Hydrology, 385: 384–397.
Kintché K., Guibert H., Sogbedji J.M., Levêque J., Bonfoh B., Tittonell P. (2015). Long-term mineral fertiliser use and maize residue incorporation do not compensate for carbon and nutrient losses from a Ferralsol under continuous maize–cotton cropping. Field Crops Research, 184: 192-200.
Kouelo Alladassi F. (2016). Effets des pratiques culturales sur la dégradation du sol au niveau des trois bassins versants du sud Bénin. Thèse de Doctorat en Sciences Agronomiques, Universités d’Abomey-Calavi, Bénin, 239 pages.
Kouli M., Soupios P., Vallianatos F. (2009). Soil erosion prediction using the Revised Universal Soil Loss Equation (RUSLE) in a GIS framework, Chania, Northwestern Crete, Greece. Environmental Geology, 57: 483-497.
Kurothe R.S., Kumar G., Singh R., Singh H.B., Tiwari S.P., Vishwakarma A.K., Sena D.R., Pande V.C. (2014). Effect of tillage and cropping systems on runoff, soil loss and crop yields under semiarid rainfed agriculture in India. Soil & Tillage Research, 140:126–134.
Lal R. (1990). Soil erosion in the tropics. Principles & Management. New York, McGraw-Hill, Inc. 580 pp.
Lal R. (1995). Erosion-crop productivity relationships for soils of Africa. Soil Science Society of America Journal, 59: 661-667.
Le Bissonnais Y., Cerdan O., Lecomte V., Benkhadra H., Souchère V., Martin P. (2005). Variability of soil surface characteristics influencing runoff and interrill erosion. Catena, 62: 111-124.
Lu D., LI G., Valladares G.S., Batistella M. (2004). Mapping soil erosion risk in rondonia, Brazilian Amazonia: using RUSLE, remote sensing and GIS. Land Degradation & Development, 15: 499–512.
Lu H., Prosser I.P., Moran C.J., Gallant J.C., Priestley G., Stevenson J.G. (2003). Predicting sheetwash and rill erosion over the Australian continent. Australian Journal of Soil Research, 41: 1037–1062.
McCool D.K., Brown L.C., Foster G.R. (1987). Revised slope steepness factor for the Universal Soil Loss Equation. Transactions of the American Society of Agricultural Engineers, 30:1387–1396.
McCool D.K., Foster G.R., Mutchler C.K., Meyer L.D. (1989). Revised slope length factor for the Universal Soil Loss Equation. Transactions of the ASAE, 32: 1571-1576.
Millward A.A, Mersey JE (1999). Adapting the RUSLE to model soil erosion potential in a mountainous tropical watershed. Catena, 38: 109–129.
Padalia K., Bargali S.S., Bargali K., Khulbe K. (2018). Microbial biomass carbon and nitrogen in relation to cropping systems in Central Himalaya, India. Current Science, 115: 1741-1750
Panagos P., Borrelli P., Poesen J., Ballabio C., Lugato E., Meusburgerb K., Montanarellaa L., Alewell C. (2015). The new assessment of soil loss by water erosion in Europe. Environmental Science & Policy, 54:438–447.
Prasannakumar V., Vijith H., Abinod S., Geetha N. (2012). Estimation of soil erosion risk within a small mountainous sub-watershed in Kerala, India, using Revised Universal Soil Loss Equation (RUSLE) and geo-information technology. Geoscience Frontiers, 3: 209-215.
Renard K.G., Foster G.R., Weesies G.A., McCool D.K., Yoder D.C. (1997). Predicting Soil Erosion by Water: A Guide to Conservation Planning with the Revised Universal Soil Loss Equation. US Department of Agriculture, Agricultural Research Services, Agricultural Handbook 703. USA.
Renard K.G., Fremund J.R. (1994). Using monthly precipitation data to estimate the R-factor in the revised USLE. Journal of Hydrology, 157: 287–306.
Roose E. (1977). Application of the Universal Soil Loss Equation of Wischmeier and Smith in West Africa. Soil Conservation Society of America, Ankeny, Iowa, 50-71 pp.
Sadiki A., Bouhlassa S., Auajjar J., Faleh A., Macaire J.J. (2004). Utilisation d’un SIG pour l’évaluation et la cartographie des risques d’érosion par l’Equation universelle des pertes en sol dans le Rif oriental (Maroc): cas du bassin versant de l’oued Boussouab. Bulletin de l’Institut Scientifique, Rabat, section Sciences de la Terre, 2004, n°26, p. 69-79.
Soo Huey T. (2011). Soil Erosion Modeling using RUSLE and GIS on Cameron Highlands, Malaysia for Hydropower Development. Master’s thesis, 76p.
Steiner K. (1994). Ursachen der Bodendegradation und Ansätzefüreine Förderung der nachhaltigen Bodennutzungim Rahmen der Entwicklung szusammenarbeit. Eschborn, GTZ: 148 Seiten.
Tamene L., Le Q.B. (2015). Estimating soil erosion in sub-Saharan Africa based on landscape similarity mapping and using the revised universal soil loss equation (RUSLE). Nutrient Cycling in Agroecosystems, 102: 17-31
Van der Knijff J.M., Jones R.J.A., Montanarella L. (2000). Soil Erosion Risk Assessment in Europe, EUR 19044 EN, 34p.
Volkoff B. (1976). Notice explicative n°66 (2). Carte pédologique de reconnaissance de la République populaire du Benin à 1/200 000. Feuille d’Abomey 2. ORSTOM, Paris, 40p.
Wall G.J., Coote D.R., Pringle E.A., Shelton I.J. (éditeurs) (2002). RUSLE-CAN-Équation universelle révisée des pertes de sol pour application au Canada. Manuel pour l’évaluation des pertes de sol causées par l’érosion hydrique au Canada. Direction générale de la recherche, Agriculture et Agroalimentaire Canada, No de la contribution AAC2244F, 117 p.
Wang G., Gertner G., Singh V., Shinkareva S., Parysow P., Anderson A. (2002). Spatial and temporal prediction and uncertainty of soil loss using the revized universal soil loss equation: a case study of the rainfall–runoff erosivity R factor. Ecological Modeling, 153: 143–155.
Wischmeier W.H., Smith D.D. (1978). Predicting rainfall erosion losses - A guide to conservation planning. Agricultural Handbook 537. USDA. Washington (DC): 58pp.
Zhang H., Yang Q., Li R., Liu Q., Moore D., He P., Ritsema C.J., Geissen V. (2013). Extension of a GIS procedure for calculating the RUSLE equation LS factor. Computer Geosciences, 52: 177-188.
Zhou P., Luukkanen O., Tokola T., Nieminen J. (2008). Effect of vegetation cover on soil erosion in a mountainous watershed. Catena, 75: 319-325.