Spatial and temporal characterization of water quality of the N'djili River in Kinshasa
Abstract
The overall objective of this study was to conduct a spatio-temporal characterization of the water quality of the N'djili River in Kinshasa through the evaluation of its physical, chemical and bacteriological parameters. Data was collected during the months of September and November 2019. The evaluation of physical parameters (pH, temperature (°C), conductivity (µS/cm), turbidity (ppm) and transparency (cm) of the water was carried out in situ. The chemical parameters (dissolved oxygen (mg/L), nitrates (mg/L), nitrites (mg/L), phosphates (mg/L), suspended solids (mg/L), oxidizable solids (mg/L), BOD5 (mg/L), COD (mg/L)) and bacteriological parameters were analyzed at the Central Laboratory located in the commune of Limete in Kinshasa. The results showed that the physical, chemical and bacteriological quality of the N'djili River water varies according to site and sampling period. In general, water of this river is more loaded during rainy periods and the Lukaya river basin, the urban drainage network and the houses in the catchment areas bring pollutants into this river. Microbiological analyses showed that the more the N'djili River crosses inhabited areas, the more it is overloaded with germs. The high density of total coliforms and Escherichia coli in the water of the N'djili River confirms the contamination of the water of this river by human and animal faecal matter.
Keywords: Quality, river water, contamination, N'djili, Kinshasa
INTRODUCTION
Population growth, increased pressure along watersheds, sand mining and other anthropogenic activities in hydrosystems are the main disturbances that affect water quality and river morphology (Hamid et al., 2007; Zinsou et al., 2016).
The first measurements of river water quality were made in the 1970's to assess these potential impacts. At that time, they focused only on chemical contamination, without taking into account the ecosystem as a whole. Only physico-chemical parameters and the presence of certain pollutants were taken into account (PNUE, 2015).
Indeed, degradation of water quality has major impacts on fisheries production, survival, conservation of aquatic biodiversity as well as the rise of waterborne diseases and the expensive treatment of water by conventional methods (Thill and Ezin, 2002; MDELECC, 2017).
Thus, a qualitative evaluation of a watercourse is important in order to monitor the evolution of physical, physico-chemical and chemical quality in the perspective of a control of the abiotic parameters aiming at the preservation of the health of the aquatic ecosystems and of the population against waterborne diseases (Akatumbila et al., 2016).
The hydrographic network of the city province of Kinshasa is dense. The rivers that compose it are classified into two categories: some cross the large agglomerations and others are located on the outskirts of the city (Munganga et al., 2020). In Kinshasa, the population cares little about the quality of the environment, especially the rivers that carry large quantities of both domestic and industrial waste. Most of the rivers are considered to be the area where all the waste produced in the city is dumped (Akatumbila et al., 2016). This is the case of the N’Djili River, the supply source for the plant which supplies drinking water to about two-thirds of the population of Kinshasa.
Kakundika et al., (2019) reported that long stretches of the N’djili River watershed are characterized by extensive market gardens where untreated droppings of poultry (chickens and ducks) and cattle (pigs and cows) are spread, unplanned discharges of garbage and wastewater into the sewage drainage system, on the river banks or directly into the river, as well as the use of chemical fertilizers and pesticides.
The overall objective of this study is to characterize the spatial and temporal quality of the N’djili River in Kinshasa through the evaluation of its physical, chemical and bacteriological parameters in order to contribute to the protection of the surface water used by most of the structures that supply drinking water to urban areas.
MATERIALS AND METHODS
Study area
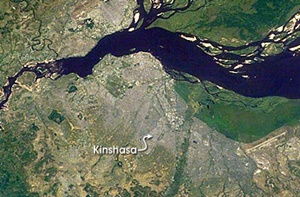
This study took place in the N’djili River (Figure 1), the section between N’djili-Brasserie (Latitude South = 04°28’24.92’’, Longitude East = 15°21’2.80’’ and Altitude = 287.6 m) and the water collection plant site only a few meters from the intersection of Boulevard Lumumba and the N’djili River (Latitude South = 04°23’14.38’’, Longitude East = 15°22’1.50’’ and Altitude = 285.5 m).
Sampling was carried out at six sites located upstream of the N’djili treatment plant’s catchment area, each of which had a number of specific characteristics. The choice of this river is justified by the fact that it is one of the rivers most used by the population of Kinshasa for various needs (two water collection and treatment plants serving the population of Kinshasa are installed along this river) but also, the N’djili River crosses several communes of the urban center of the city of Kinshasa before flowing into the Congo River.
To characterize the physico-chemical quality of the surface waters of the N’djili River, the analyses were carried out on three levels: physical, chemical and bacteriological.
Collection and conservation of water samples
The collection of water samples is a delicate operation to which the greatest care must be taken. It conditions the analytical results and the interpretation that will be given. Special attention must also be paid to the sampling equipment (Rodier et al., 2009).
Water samples from the N’djili River for chemical analysis were collected during three months from September to November 2019. In total, nine data collection campaigns were conducted at a rate of three campaigns per month. Sterilized 1000 ml plastic galleons were used to hold the water samples. Once collected, the vials were labeled and stored in an isothermal container (a cooler) maintained at 4°C in accordance with AFNOR NF 25667 (ISO 5667) (AFNOR, 2004).
Analysis of physical parameters
The evaluation of physical parameters (pH, temperature (°C), conductivity (µS/cm), turbidity (ppm) and transparency (cm) of the N’djili River was carried out in situ. The sampling of pH, temperature, conductivity and turbidity was carried out with a set of instruments including: a pH meter (WTW Inolab series), a multiparametric probe (Combo HANNA HI119), turbidimeter (HACH 2100Q 01), a conductivity meter (METTLER Toledo) and a colorimeter (HANNA Instrument).
Analysis of chemical parameters
The analysis of chemical parameters was carried out at the Central Laboratory of REGIDESO located in the commune of Limete in Kinshasa. Several chemical parameters were evaluated including: dissolved oxygen (mg/L), nitrates (mg/L), nitrites (mg/L), phosphates (mg/L), suspended solids (mg/L), oxidizable matter (mg/L), BOD5 (mg/L) and COD (mg/L).
Dissolved oxygen (DO) was measured in situ using a VWR multi-probe oximeter. The determination of nitrate, nitrite and phosphate concentrations was done by spectrophotometry using a visible UV spectrophotometer (HACH LANGE DR 3900), while suspended solids (SS) were determined by the membrane filtration method with the use of a vacuum filtering device followed by differential weighing after oven drying at 105°C for four hours and then drying for about 2 hours. Oxidizable matter (MOx) was determined by hot redox titration (manganometry), while BOD5 was determined by the OxiTop manometric digestion method and COD by successive mineralization followed by volumetric titration. The alkalinity (TA and TAC) was first measured by acid-base titration (neutralization) after adding a strong acid to the sample and 3 to 5 drops of phenolphthalein indicator into 100 ml of the sample. This first step allowed the reading of the TA; a second step is titrating the last solution with H2SO4N/50 followed to determine the TAC.
Microbiological analysis of the samples
The bacteriological analyses were carried out at the Central Laboratory of REGIDESO. For the enumeration of total and fecal coliforms, decimal dilutions up to 1/10.000th in a Ringer’s solution were performed. Then, 0.1 ml of each dilution is spread on the surface of the solid medium of Mac Conkey Agar (MCA) contained in a Petri dish. The plated dishes were incubated at 37 or 44°C to enumerate total coliforms or isolate fecal coliforms, respectively (Wanga et al., 2014).
The result is expressed as colony forming units per 100 ml of sample according to the following general equation: CFU = NCD/VEE (ml)/100 of which: CFU expresses the Colony Forming Units, NCD is the Number of Colonies Enumerated and VEE expresses the Volume of Sample Plated in ml.
For the detection of Escherichia coli, the samples were diluted in Mac Conkey Broth (MBC) and Azide Dextrose Broth (ADB), respectively. After 4 hours of incubation at 37°C, using a flaming loop, aliquots of these pre-cultures were plated on the surface of Mac Conkey Agar (MCA) solid medium. Incubation took place at 44°C for 24 hours. Leminoir Gallery consisting of the tubes each containing Kligler’s medium, Simmons Citrate or Sim Medium was used to identify the strains corresponding to those of Escherichia coli (Craun et al., 1997; Edberg et al., 2000; Wanga et al., 2014).
Analysis and statistical processing of data
The data obtained from different sampling, analysis and observations were statically processed in order to ensure their reliability. Means and standard deviations of the evaluated physico-chemical parameters were calculated. Means were compared by analysis of variance (ANOVA 1) (Scherrer, 1984) with Fisher’s test (Saville, 1990) coupled with Tukey HSD test using Statistix software version 10.
The Ascending Hierarchical Classification (HHC) analysis for similarity distances between ecological entities (Eume et al., 2022), sampling sites in this case, was carried out with the PaSt software (Paleontological Statistics, Version 2.16). It consisted of grouping ecological entities or sampling sites with similar characteristics on the basis of physical, chemical and bacteriological parameters of the surface waters of the N’djili River in order to estimate the closeness of the sampling sites as well as the spatial variation of the quality of this watercourse. Origin 6.1 software was used to draw the graphs and the mapping of the sampling sites was generated with ArcGIS software (version 10.8).
RESULTS
Physical parameters of the surface water of the N’djili River
Variation in pH
In general, the hydrogen potential values are slightly acidic across the different sampling sites and throughout the study period with a trend toward neutrality (Figure 2). In terms of sites, the highest average values (7.27 ± 0.03 and 7.05 ± 0.5) were obtained respectively at sites S5 and S1 during November and the lowest averages (6.63 ± 0.07 and 6.59 ± 0.3) were found respectively at sites S5 and S6 during September. Analysis of variance applied to the pH data shows a highly significant difference (F = 9.93; p = 0.0004) between mean pH values as a function of sampling period. The Tukey HSD test (0.1568) reveals that November has a higher mean pH (6.92 ± 0.17) than October (6.69 ± 0.08) and September (6.65 ± 0.06).
Temperature Variation
Surface waters of the N’djili River remained warm with Some variation in temperature across sites and time periods (Figure 3). The highest temperature values were recorded at sites S2 (26.4 ± 0.5 °C) and S4 (26.0 ± 0.1 °C) during September and October respectively. Although having different means, analysis of variance showed that no significant difference (F = 0.44; p = 0.6474; Tukey HSD = 1.1484) in water temperature is observed between the different sampling periods (September = 25.0 ± 0.87 °C, October = 25.5 ± 0.5 °C and November = 25.3 ± 1.26 °C).
Variation in turbidity
During the sampling period, the waters of the N’djili River showed profound variations in turbidity with a very highly significant difference (F = 51.7; p = 0.0000). The Tukey HSD test (19.221) showed that water is more turbid during November (turbidity = 96.5 ± 15.8 NTU) than during September (turbidity = 28.5 ± 12.6 NTU) and October (turbidity = 26.8 ± 20.2 NTU). In terms of sites, the highest averages were obtained at sites S1 (125.5 ± 2.6 NTU) and S4 (118.7 ± 0.8 NTU) during November and the lowest average concentrations were found at sites S2 (12.6 ± 0.4 NTU) and S3 (12.9 ± 0.1 NTU) (Figure 4).
Variation in conductivity
The waters of the N’djili River show low mineral content over time and space. Low electrical conductivity was observed in sites S4 (conductivity = 13.6 ± 1.4 µS/cm) and S3 (conductivity = 13.8 ± 0.25 µS/cm) during the month of November, and the highest average value is found in site S1 (92.7 ± 0.25 µS/cm) during the month of October (Figure 5). The analysis of variance applied to the monthly averages showed no significant difference (F = 2.16; p = 0.1319; Tukey HSD = 17.160) between the sampling periods, although the month of October has a higher average conductivity (37.5 ± 18.7) than September (26.1 ± 6.68) and November (24.0 ± 7.23).
Variation in total dissolved salts
Total dissolved salt content is highest at site S1 (38.8 ± 1.15 mg/L) during October and the lowest concentration is obtained at site S3 (6.7 ± 0.4 mg/L) during November (Figure 6). The analysis of variance applied to these data showed that there was no significant difference (F = 2.00; p = 0.1519) between the means despite the Tukey HSD test (7.0420) showing that the month of October with 17.6 ± 7.7 mg/L of higher concentration than the months of September (13.9 ± 2.38 mg/L) and November (12.0 ± 3.6 mg/L).
Color of surface waters
The waters of the N’djili River showed an apparent variation in color from site to site and from period to period. The lowest absorption value is found at site S3 (155 ± 5 HZN) during October and the highest value is observed at site S4 (860 ± 20 HZN) during November (Figure 7). The analysis of variance applied to the data showed a highly significant difference (F = 52.3; p = 0.0000) between the monthly averages, the critical value (121.3) of the Tukey HSD test reveals that during the month of November (685.0 ± 119.2 HZN) the waters present a very high average value tending to turbid waters than during the month of September (253.7 ± 110 .0 HZN) and the month of October (240.8 ± 74.4 HZN).
Chemical parameters of the surface waters of the N’djili River
Variation of dissolved oxygen
Low dissolved oxygen levels were noted across the different sites and study periods (Figure 8). The highest dissolved oxygen levels were found at sites S2 (3.25 ± 0.15 mg/L) during November and S4 (3.1 ± 0.5 mg/L) during October with low concentrations at sites S5 (1.6 ± 0.1 mg/L) and S3 (2.2 ± 0.2 mg/L). Analysis of variance applied to these data showed a very highly significant difference (F = 27.7; p = 0.0000) between the means of the different periods. The Tukey HSD test (0.2915) reveals that during the months of November (O2 = 3.04 ± 0.12 mg/L) and October (O2 = 2.89 ± 0.21 mg/L) the waters of the N’djili River had a higher dissolved oxygen concentration than during the month of September (O2 = 2.21 ± 0.31 mg/L).
Variation in nitrite concentration (mg/L)
The nitrite concentration varied according to site and sampling period. A highly significant difference (F = 8.92; p = 0.0008) was found between the different means. With a critical comparison value of 0.4939, the Tukey HSD test reveals that the highest nitrite concentration is found during September (0.74 ± 0.58 mg/L) followed by October (0.01 ± 0.00 mg/L) and November (0.00 ± 0.00 mg/L). In terms of sites, S4 (0.65 ± 0.5 mg/L) and S5 (0.6 ± 0.1 mg/L) showed high nitrite levels during September (Figure 9).
Variation in nitrate concentration (mg/L)
The variation in nitrate concentration in the N’djili River water is site-specific and period-specific. The highest average nitrate values were obtained in sites S1 (15 ± 1 mg/L), S4 (13.8 ± 1.15 mg/L) and S5 (13.1 ± 0.85 mg/L) during the month of November while the lowest values are observed in sites S3 (1.1 ± 0.1 mg/L and 1.2 ± 0.1 mg/L) during the month of October and September respectively (Figure 10). Analysis of variance established a very highly significant difference (F = 121; p= 0.0000) between the monthly means. The Tukey HSD test (1.7996) reveals that during the month of November (12.2 ± 2.11 mg/L) the water had a higher nitrate concentration than during the months of October (2.56 ± 1.24 mg/L) and September (2.06 ± 0.65 mg/L).
Variation in phosphate concentration (mg/L)
Variations in phosphate concentration in the N’djili River are noted during the study period from one site to another (Figure 11). The lowest levels are observed in the waters of sites S2 (0.7 ± 0.1 mg/L) and S4 (0.8 ± 0.1 mg/L) during the month of September, and the highest values are noted in sites S2 (3.9 ± 0.1 mg/L) and S1 (3.58 ± 0.15 mg/L) The analysis of variance showed no significant difference (F = 2.47; p = 0.1003) between the means of the different sampling periods despite the fact that the Tukey HSD test (1.8764) reveals that during November (3.63 ± 0.29 mg/L) the waters have higher phosphate concentrations than during September (3.08 ± 2.77 mg/L) and October (1.96 ± 0.56 mg/L).
Concentration of suspended solids (mg/L)
In general, the concentrations of suspended solids show a spatio-temporal evolution. The low TSS concentrations are obtained in sites S2 (6 ± 1 mg/L) and 3 (7.25 ± 0.75 mg/L) during the month of October while the highest concentrations are obtained in sites S6 (84.7 ± 1.25 mg/L), S4 (78 ± 1 mg/L) and S1 (75.2 ± 1.8 mg/L) during the month of November. Analysis of variance showed a highly significant difference (F = 82.6; p = 0.0000) between the monthly means. The critical comparison value (11.023) of the Tukey HSD test showed that during the month of November (64.6 ± 14.7 mg/L) the waters of the N’djili River are more concentrated in TSS than during the months of October (14.6 ± 5.86 mg/L) and September (14.6 ± 5.8) (Figure 12).
Concentration of oxidizable matter (mg/L)
Spatially, the highest concentrations of oxidizable matter are found at sites S1 (22 ± 2 mg/L) during November and S4 (21.2 ± 1.75 mg/L) during September while the lowest concentrations are obtained at sites S2 (7.6 ± 0.4 mg/L) and S3 (8.9 ± 0.1 mg/L) during October (Figure 13). Analysis of variance (F = 34.9; p = 0.0000; Tukey HSD = 2.8026) showed that over time, the highest concentrations of oxidizable materials are observed during the months of November (19.6 ± 1.69 mg/L) and September (16.9 ± 3.02 mg/L) than October (10.3 ± 1.97 mg/L).
Variation in the concentration of biological oxygen demand (mg/L)
The high biological oxygen demand is observed in sites S5 (7.5 ± 0.5 mg/L) and S2 (6.5 ± 0.5 mg/L) during the month of November and the low demand is obtained in sites S1 and S4 with respectively 3 ± 1 mg/L during the month of September (Figure 14). The analysis of variance applied to the data revealed no significant differences (F = 2.20; p = 0.1268; Tukey HSD = 1.4723) between the monthly means despite the fact that the highest BOD5 concentrations are observed during the months of November (5.17 ± 1.52 mg/L) and October (4.66 ± 1.05 mg/L) than during September (3.91 ± 0.94 mg/L).
Variation in the concentration of chemical oxygen demand (mg/L)
The amount of oxygen consumed by the chemical oxidation of materials in the water of the N’djili River varies in time and space (Figure 15). Spatially, high oxygen consumption is observed at sites S4 (240 ± 10 mg/L) and S6 (205 ± 5 mg/L) during the month of November while at site S1 (3 ± 0.5 mg/L) during the months of September and October respectively and site S4 (3 ± 0.5 mg/L) during the month of September. Analysis of variance showed that there was a highly significant difference (F = 116; p = 0.0000) between the different monthly means. With a critical comparison value of 28.5, the Tukey HSD test reveals that during November (177.5 ± 37.9 mg/L) oxygen consumption is intense than during October (29.6 ± 9.01 mg/L) and September (18.9 ± 12.4 mg/L).
Bacteriological analysis
Bacteriological analyses of surface water samples from the N’djili River across the selected six sites of this study are recorded in table 1.
The water samples from the N’djili River are characterized by a significant presence of germs, particularly total coliforms and Escherichia coli, with a variation in time and space. The highest concentrations of total coliforms are found in sites S4 (24000 ± 1000 MPN/100 ml), S1, S5 and S6 with respectively (16000 ± 1000 CFU/100 ml) during the month of November. The analysis of variance applied to the bacteriological data showed a very highly significant difference (F = 19.3; p = 0.0000) between the means; with a critical comparison value of 3462 the Tukey HSD test revealed that the November samples (12475 ± 7366 CFU/100 ml) had a higher concentration than the October (1880 ± 566 CFU/100 ml) and September (1742 ± 492 CFU/100 ml) samples. The same observations are made for Escherichia coli germs, which showed high concentrations in samples from sites S4 (20000 ± 1000 CFU/100 ml), S1 (9750 ± 250 CFU/100 ml) and S5 (5350 ± 350 CFU/100 ml) during the month of November. Analysis of variance established a highly significant difference (F = 5.54; p = 0.0084); the critical value of comparison of the Tukey HSD test (4186) shows that the samples collected during the month of November (6362 ± 5675 CFU/100 ml) are highly loaded with E. coli than the samples from October (1572 ± 456 CFU/100 ml) and September (1325 ± 292 CFU/100 ml). The results of the microbiological analysis showed that the more the N’djili River crosses inhabited areas, the more it is loaded with germs.
Hierarchical ascending classification of study sites according to water quality
The classification of the different study sites according to physical, chemical and bacteriological parameters shows the proximity of the different sites according to their affinity, based on monthly averages of each parameter.
On the basis of physical parameters
The ascending hierarchical classification of the sampling sites based on the physical parameters of the N’djili River revealed two large groups of sites that are very significantly different (R2 = 0.9345) at a Euclidean distance of 99 (Figure 16). The first group is made up of four sites, namely S5, S2, S3 and S6, which are similar in terms of physical parameters. The sites S4 and S5 form the second group which is 20 away from the first group.
Based on chemical parameters
Based on chemical parameters, the ascending hierarchical classification of the sampling sites highlights two large groups of sites that are very significantly different (R2 = 0.8708), each formed by three sites that are similar from a chemical point of view (Figure 17). The first group is formed by sites S4, S6 and S5 located at a Euclidean distance of 15 from the second group, while sites S2, S3 and S1 at a distance of 18 from the others form the second group.
Based on bacteriological parameters
Of the six sampling sites surveyed, sites S4 and S1 are very similar and form the first group significantly different (R2 = 0.8201) from the group formed by four sites including S2, S3, S5 and S6 which are separated from the sites in the first group by a Euclidean distance of 3500 (Figure 18).
DISCUSSION
Results of this study showed that the physical, chemical and microbiological quality of the water of the N’djili River varied from one site to another and from one period to another.
November was the month with a higher mean pH (6.92 ± 0.17) than October (6.69 ± 0.08) and September (6.65 ± 0.06). These results are close to those obtained by Musanga et al., (2019) in the Lukaya River and its tributaries in Kinshasa during both dry and rainy periods. Indeed, during the month of September, there was no rainfall. The month of October corresponds to the beginning of the rains, the pH undergoes a small increase and increases suddenly in November, which corresponds to the rainiest month. When it rains, rainwater runs off and carries polluting substances along its path and discharges them into the receiving environment. In this case, it turns out that these substances are alkaline in nature, so that they react with the acidic water, which changes from acidic to alkaline with the amount of rainfall. The same observation was made by Djermakoye (2005). Furthermore, in their study on the spatio-temporal characterization of the water quality of the Kinyankonge River in Burundi, Buhungu et al., (2018), found high pH (basic pH) during the dry season and attribute this to the dilution of the river water by rainwater (De Villers et al., 2015).
The river water was more turbid during November (turbidity = 96.5 ± 15.8 NTU) than during September (turbidity = 28.5 ±12.6 NTU) and October (turbidity = 26.8 ± 20.2 NTU). In terms of sites, the highest average concentrations were obtained at sites S1 (125.5 ± 2.6 NTU) and S4 (118.7 ± 0.8 NTU) during the month of November and the lowest average concentrations were found at sites S2 (12.6 ± 0.4 NTU) and S3 (12.9 ± 0.1 NTU). In nature, water interacts with its environment, carrying material with which it reacts. A first possible interaction is the suspension of matter. Suspended sediments, composed of very fine sand, silt and clay, can be responsible for the change in color and turbidity of water in rivers and lakes (Elhammoumi et al., 2017). These mineral particles of rock origin are derived from soil erosion processes (Eisma, 1993). Monthly means showed no significant difference between the different sampling periods, although October had a higher average conductivity (37.5 ± 18.7) than September (26.1 ± 6.68) and November (24.0 ±7.23). The significance of these results is that ion loads are much denser during the dry season. This situation is justified by the phenomenon of evaporation, which favors, over time, the decrease in the volume of water and the concentration of dissolved ions in a reduced volume of water and thus a significant ionization of the medium. The variation of conductivity from one site to another would be due to the discharge of wastewater into water pipes and rivers actually containing electrical discharges (+ and -) and that their concentrations are higher with the decrease in the volume of water of the receiving medium (Buhungu et al., 2018; Kambole, 2003; Tshibanda et al., 2014; Atibu et al., 2013).
Total dissolved salt concentrations (mg/L) of the water showed that no significant differences despite the fact that the month of October had a higher concentration (17.6 ± 7.7 mg/L) than the months of September (13.9 ± 2.38 mg/L) and November (12.0 ± 3.6 mg/L). The TDS is equivalent to the total mineralization which corresponds to the sum of anions and cations present in the water. This mineralization is the result of the passage of organic substances in the soil to the mineral state under the action of microorganisms (Kambiré et al., 2014). The mineralization into total dissolved salt occurred at half the concentration of the electrical conductivity of liquid solutions; leading to the belief that the two parameters have the same causal effects (Buhungu et al., 2018; Tepe and Mutlu, 2005).
During the month of November the water showed a very high color value (685.0 ±119.2 HZN) tending to turbid water than during the month of September (253.7 ± 110.0 HZN) and October (240.8 ± 74.4 HZN). The change in water color due to sediment can be temporary, after a flood or storm, or permanent if the river is permanently carrying a high amount of sediment (Eisma, 1993). In contrast, turbidity plays a major role in the color of a river water, where the concentration of TSS can be estimated on average at 102 mg per liter (Akutmbila et al., 2016).
Dissolved oxygen data showed a very highly significant difference between different periods. During the months of November (O2 = 3.04 ± 0.12 mg/L) and October (O2 = 2.89 ± 0.21 mg/L) the water of the N’djili River had a higher dissolved oxygen concentration than during the month of September (O2 = 2.21 ± 0.31 mg/L). This trend is thought to be due to rainfall that increases the dissolved oxygen content in surface waters (Tepe and Mutlu, 2005). This can be justified by the fact that the rain, while falling, collects oxygen from the atmosphere that it brings in addition to the environment that receives it. In surface waters, dissolved oxygen also depends on the volume of water, the surface of the bed, the flow speed, the movements (rapids, falls and eddies) but also on the aquatic vegetation (Lisec, 2004). Given the increasing evolution of the trend curve from the dry season to the rainy season, it is clear that the species living in the N’djili suffer in the dry season and regain their vitality with the arrival of the rains. The high nitrite concentrations are believed to be the result of point source discharge of toxic materials into the river. Lisec, (2004) reports that the situation is very critical at concentrations above 3 mg/L. The consequence of these results is that the concentration of nitrite is greater in waters sampled in the dry season. This would be the result of point source discharge of garbage into the river. In Kinshasa, the heavy metal and dye-charged effluents generated by the many artisanal ironworks and vehicle battery repair facilities that dump on the ground or discharge directly into streams or the storm water drainage system (Vuni et al., 2021). Lisec (2004) suggests that elevated nitrite concentrations often indicate the presence of toxic materials and are considered very critical at concentrations above 3 mg NO2-/L.
During the month of November (12.2 ± 2.11 mg/L) river water had a higher concentration of nitrates than during October (2.56 ± 1.24 mg/L) and September (2.06 ± 0.65 mg/L). This situation is the confirmation, with more than one author ,that nitrates reach surface waters from runoff, land leaching after fertilizer application, domestic wastewater (Khalaf et al., 2009; Saad et al,. 2004). In a study conducted in the N’djili River, Kakundika et al. (2019) reported that several pastoral (large and small livestock, poultry, etc.) and market gardening activities are practiced mainly along this river.
No significant difference in phosphate concentration between the sampling periods, although during the month of November (3.63 ± 0.29 mg/L) the waters have higher phosphate concentrations than during September (3.08 ± 2.77 mg/L) and October (1.96 ± 0.56 mg/L). The different phosphate levels found can be explained by urban discharges from nearby settlements and the release of phosphorus trapped in large quantities in the sediments (Elhammoumi et al., 2017). The presence of phosphorus in rivers would also be the work of direct spreading of substances likely to generate phosphorus just as it can be the work of several poultry and pig farms but also agricultural located in the protection perimeters of rivers (De Villers et al., 2015; Khalaf et al., 2007).
During the month of November the waters of the N’djili River were more concentrated in TSS (64.6 ± 14.7 mg/L) than during October (14.6 ± 5.86 mg/L) and September (14.6 ± 5.8). These high levels may be the result of a sudden hydrological event (flood), whose alluvial load can be attributed to intense erosion of the watershed, following stormy rains (Elhammoumi et al., 2017), accentuated by discharges of waste and filth into the stream (Kakundika et al., 2019). In some sample stations, this stream serves as a conduit for urban effluent, fertilizer, sewage, or other waste from households (Tangou, 2016).
The biological oxygen demand revealed no significant difference between the monthly averages, although the highest BOD5 concentrations were observed during the months of November (5.16 ± 1.52 mg/L) and October (4.66 ± 1.05 mg/L) than during September (3.91 ± 0.94 mg/L). Indeed, high BOD5 values are for most cases, due to leaching of accumulated organic matter in the dry season to the surrounding streams (Buhungu et al., (2018). Sites S5 and S6 share the high concentrations with the highest repetition at S5. This means that the sites located in the middle of the urban area have high BOD5 compared to the other peri-urban sites. The abundant domestic discharges, animal and human dejecta and sewage would be the basis of the very high BOD5 (Elhammoumi et al., 2017).
Chemical oxygen demand concentrations showed that there is a very highly significant difference between the different monthly means. During November oxygen consumption was intense (177.5 ± 37.9 mg/L) than during October (29.6 ± 9.01 mg/L) and September (18.9 ± 12.4 mg/L). The COD-BOD correlation had been proven by several authors including Buhungu (2005) and Yangongo (2020). The COD represents the major part of the organic compounds but also of the oxidizable mineral salts (sulfides, chlorides, etc.) and confirms the concentrations of the oxidizable matters noted in this study. These results showed that the waters collected by REGIDESO on the N’djili River are clearly and distinctly impacted by solid waste and urban and domestic effluents, but also by the waste from more or less organized agropastoral activities within the Lukaya watershed.
As for fecal coliforms, their presence in water usually indicates contamination of fecal origin, although in some cases these microorganisms may come from industrial effluents (Barthe et al., 1998; WHO, 2000). The increasing amount of E. coli in the water of the N’djili River as it flows through the populated areas indicates that fecal residues are being discharged into the river, which constitutes a public health hazard for users of the water, particularly for drinking and washing dishes. E. coli is a coliform bacterium naturally found in the intestines of humans and warm-blooded animals. It usually makes up 80-90% of fecal coliforms (Wanga et al., 2014). This bacteria is usually not present in other natural environments such as plants, soils or water if this has not been contaminated (Elhammoumi et al., 2017). Its presence in a water is an indicator of recent fecal contamination (Eckner, 1998; Elmund et al., 1999). The high density of E. coli in the water of the N’djili River confirms the contamination of the water of this river by human fecal matter.
CONCLUSION
The overall objective of this study was to conduct a spatio-temporal characterization of the quality of the N’djili River in Kinshasa through the evaluation of its physical, chemical and bacteriological parameters. After analysis, it was found that the physical, chemical and bacteriological quality of the N’djili River varies according to the site and to the sampling period. In general, the water of this river was more loaded during rainy periods and the Lukaya River basin, the urban drainage system and the houses in the watersheds bring pollutants into this river. Microbiological analyses have shown that the more the N’djili River crosses inhabited areas, the more it is overloaded with germs. The high density of total coliforms and Escherichia coli in the water of the N’djili River confirms the contamination of the water of this river by human and animal faeces. The development of the urban water drainage network and the improvement of the environment through a control system would overcome the situation.
REFERENCES
AFNOR (Association Française de Normalisation). (2004). Essai des eaux: Détermination de l’indice biologique global normalisé (IBGN). Association Française de Normalisation. Norme homologuée, T 90 – 350, 9 p.
Akatumbila L., Mabiala M., Lubini A., Pwema K., Musibono E.A. 2016. Contribution à l’évaluation de la qualité physico-chimique de l’eau: cas de la rivière urbaine Gombe de Kinshasa/République Démocratique du Congo. Larhyss Journal, 26: 7-29.
Atibu K.E., Devarajan N., Thevenon F., Paola M.M., Tshibanda J., Mpiana T.P., Prabakar K., Mubedi I.J., Wildi W., Poté J. (2013). Concentration of metals in surface water and sediment of Luilu and Mosonoie rivers, Kolwezi-Katanga, Democratic Republic of the Congo. Appl. Geochemist., 39: 26-32.
Barthe C., Perron J., Perron J.M.R. (1998). Guide d’interprétation des paramètres microbiologiques d’intérêt dans le domaine de l’eau potable. Document de travail (version préliminaire), ministère de l’Environnement du Québec.
Buhungu S., Montchowui E., Barankanira E., Sibomana C., Ntakimazi G., Bonou C.A. (2005). Caractérisation spatio-temporelle de la qualité de l’eau de la rivière Kinyankonge, affluent du Lac Tanganyika, Burundi. Int. J. Biol. Chem. Sci., 12: 576-595.
Craun G.F., Berger P.S., Calderon R.L. (1997). Coliform bacteria and water borne disease outbreaks. Journal of the American Water Works Association, 89: 96-104.
De Villers J., Squilbin M., Yourassowsky C. (2015). Qualité physico-chimique et chimique des eaux de surface: cadre général. Institut Bruxellois pour la Gestion de l’Environnement/Observatoire des Données de l’Environnement, Bruxelles, Belgique, 64 p.
Degremont S.A. (2005). Mémento technique de l’eau. 10ème Ed. Tome 1; Paris, ISBN 978-2-7430-0717-1, 1718 p.
Djermakoye H.M.M. (2005). Les eaux résiduaires des tanneries et des teintureries : caractéristiques physico-chimiques, bactériologiques et impact sur les eaux de surface et les eaux souterraines. Thèse de Doctorat, Université de Bamako, République de Mali, 135 p.
Eckner K.F. (1998). Comparison of membrane filtration and multiple-tube fermentation by the Colilert and Enterolert methods for detection of waterborne coliform bacteria, Escherichia coli and Enterococci used in drinking and bathing water quality monitoring in southern Sweden. Appl. Env. Microbiol., 64: 3079-3083.
Edberg S.C., Rice E.W., Karlin R.J., Allen M.J. (2000). Escherichia coli: the best biological drinking water indicator for public health protection. Journal of Applied Microbiology, 88: 106 -116.
Eisma L. (1993). Transport of suspended matter in the Aquatic Environment. Springer Berlin Heidelberg, ISBN 978-3-642-77724-0, 78–130.
Elhammoumi T., Elatmani A., Lakhlifi M., Hamdaoui F., Elborjy A., Sibari M., Benchikh M., Achhar A., Elbourkadi A., Ztit G., Belghyti D., El Kharrim K. (2017). Assessment of the waters physicochemical quality of the middle Sebouriver at Kariat Bamohamed (Fez-Morocco). JOWSET, 2:193-199.
Elmund G.K., Allen M.J., Rice E.W. (1999). Comparison of Escherichia coli, total coliform and fecal coliform populations as indicators of wastewater treatment efficiency. Water Environ. Res., 71: 332-339.
Eume L.T., Lusasi S.W., Nsimanda I.C., Isumbisho M.P., Pwema K.V. (2022). Contribution to the knowledge of freshwater shrimps (Crustacea, Decapoda) and their spatial distribution in the Malebo Pool (Congo River), R.D Congo. Annual Research & Review in Biology, 37: 30-43.
Hamid B., Nassif N., El Samrani A., Daoud R., Medawar S. (2007). Suivi de la qualité bactériologique des eaux de surface (rivière Nahr Ibrahim, Liban). Revue des Sciences de l’Eau, 20: 341-352.
Kakundika M.J., Musibono E.D., Saila I.Y., Tangou T.T. (2019). Facteurs environnementaux dégradants des cours d’eaux urbains: Cas de la rivière N’djili à Kinshasa (RDC). International Journal of Innovation and Applied Studies, 27: 818-830.
Kambiré O., Adingra A.A., Eblin S.G., Aka N., Kakou A.C., Koffi-Nevry R. (2014). Caractérisation des eaux d’une lagune estuarienne de la Côte d’Ivoire: la lagune Aby. Larhyss Journal, 20: 95-110.
Kambole M.S. (2003). Managing the water quality of the Kafue River. Phys. Chem. Earth, 28: 20-27.
Khalaf G., Slim K., Abi-Ghanem C., Nakhlé K., Fakhri M. (2009). Caractérisation et corrélation des paramètres biotiques et abiotiques des eaux du Nahr El Bared. Lebanese Science Journal, 10: 3-21.
Khalaf G., Slim K., Saad Z., Nakhlé K. (2007). Évaluation de la qualité biologique des eaux du Nahr el Jaouz (Liban): application des méthodes indicielles. Bull. Mens. Soc. Linn. Lyon, 76: 255-268.
Lisec. (2004). Les différents paramètres physiques et chimiques: in Contrôle van de fysicochemische kwaliteit van de viswaters van het Brussels Hoofdstedelijk Gewest. Rapport effectué pour le compte de l’Institut Bruxellois pour la Gestion de l’Environnement (IBGE).
MDDELCC (Ministère du Développement Durable, de l’Environnement et de la Lutte contre les Changements Climatiques/Canada). (2017). Guide de caractérisation physico-chimique de l’état initial du milieu aquatique avant l’implantation d’un projet industriel, Québec. Direction générale du suivi de l’état de l’environnement.
Munganga K.C., Kavumbu M.S., Kunonga N.L., Lusasi S.W., Pwema K.V. (2020). Evaluation de la qualité écologique de la rivière Musolo à Kinkole basée sur les macroinvertébrés benthiques (Kinshasa, R.D Congo). European Journal of Scientific Research, 155: 162-176.
Musanga M.J., Thambwe M.T., Isulu M.G., Landa A. (2019). Détermination de quelques paramètres indicateurs de la pollution organique de la rivière Lukaya à Kinshasa en République Démocratique du Congo. Congo Sciences, 118-126.
OMS. (2000). Directives de qualité pour l’eau de boisson. Critères d’hygiène et documentation à l’appui, Volume 2, 2e Ed, Disponible sur sur www.who.int/water_sanitation_health/ GDWQ/Summary_tables. 13/7/2013.
PNUE (Prograe des Nations Unies pour l'Environnement). (2015). L’avenir de l’environnement en Afrique. Notre richesse.
Rodier J., Bazin C., Bourtain J.P., Chambon P., Champsaur H., Rodi L. (2009). L’analyse de l’eau: eau naturelle, eaux résiduaires, eau de mer. Ed. Dunod, Paris. 8ème édition, 1383 p.
Saad Z., Slim K., Khalaf G., Elsamad O. (2004). Impact des rejets des eaux résiduaires sur la qualité physico-chimique et algologique du Nahr Antélias. Bulletin de la Société Neuchâteloise des Sciences Naturelles, 127: 69-82.
Saville D.J. (1990). Multiple comparaison procedures: the pratical solution. American Statistician, 44 : 174-180.
Scherrer B. (1984). Biostatistique. Gaëtan Morin: Québec, 850 p.
Tangou T.T. (2016). Technologie de l’eau et des eaux usées. Kinshasa, République Démocratique du Congo, 139 p.
Tepe Y., Mutlu E. (2005). Physico-chemical Characteristics of Hatay Harbiye Spring water, Turkey. J. Inst. Sci. Tech., 6: 77-88.
Thill G., Ezin J-P. (2002). Eau, patrimoine mondial commun. Ed. Hatier, Paris, 78 p.
Tshibanda J.B., Devarajan N., Birane N., Mwanamoki P.M., Atibu K.E., Mpiana T.P., Prabakar K., Mubedi I.J., Wildi W., Poté J. (2014). Microbiological and physicochemical characterization of water and sediment of an urban river: N’djili River, Kinshasa, Democratic Republic of the Congo. Sustainability of Water Quality and Ecology, 3: 47-54.
Vuni S.A., Likinda B.H., Kisangala M.M., Aloni K.J., N’zau U-di- M.C. (2021). Analyse du système d’évacuation des eaux usées domestiques et pluviales dans le quartier Industriel/Commune de Limete, Kinshasa. Congo Sciences, 9:71-78.
Wanga B.M., Musibono D.E., Mpiana P.T., Mafuana L., Kiza N.J., Diana. (2014). État microbiologique des eaux de la rivière Kalamu de Boma et son influence sur la santé de la population. Congo Sciences, 2: 15-20.
Yangongo M.T. (2020). Traitement des eaux usées domestiques par le Pistia stratiotes L. dans la commune da la N’sele à Kinshasa. Mémoire de DEA en Sciences Biologiques, Université de Pédagogique Nationale, Kinshasa, R.D Congo, 131 p.
Zinsou H.L., Attingli A.H., Gnohossou P., Adandedjan D., Laleye P. (2016). Caractéristiques physico-chimiques et pollution de l’eau du delta de l’Oueme au Bénin. Journal of Applied Biosciences, 97: 9163.